What are different sectors in stock market

Which one among Reality sector and Banking sector has given more returns in last 5 yrs and 10 yrs with lump sum and SIP way of investing ? Have you ever tried to find out which sectors among indian indices are doing well and which are not ? In this data-oriented article will take you into the world of different sectoral indexes on Nifty, like Bank Nifty , CNX IT , CNX Pharma , NCX FMCG and some more like those . We will see their performances compared with each other with graphs. Note that I have also taken NIFTY as one of the index to compare it with a broader index even though it’s not a sector specific .

Which sectors ?

In this study you will come to know about lump sum and SIP performance of various sectors for 5 yrs and 10 yrs time frame. I have taken the raw data from NSE website and done all the number crunching and graphing to come out with charts which shows you how money has grown in various sectors . I have taken 6 sectors ( Nifty , Bank Nifty , Energy , Pharma , FMCG) for 10 yrs time frame and 8 sectors for 5 yrs time frame (6 mentioned earlier + Reality + Infra ) .  We will see the results of 4 different scenarios and will see major learnings from those .

10 yrs performance [Lumpsum Investment]

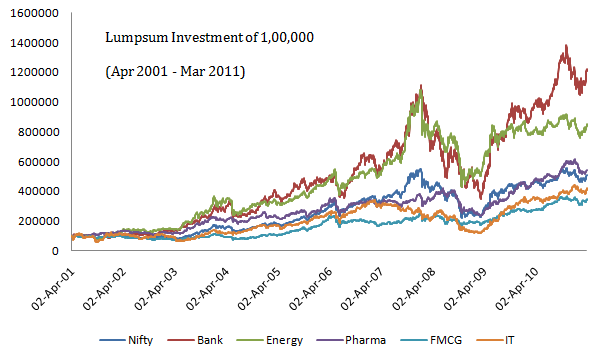
The chart below shows the sectoral performance + Nifty for a lump sum investment of Rs 1 lac in last 10 yrs  .
 different sectors in stock market

Observations

  • Bank Nifty was the clear out performer among all giving a 12x return in just 10 yrs . That’s very good return . Energy sector came second and FMCG and IT sector gave the least returns out of all .
  • Bank Nifty has given 3x return after the crash of 2008-09 . Look at the big spike upwards . Till the crash Energy sector was performing same to same as Bank Nifty , but after the crash, performance of Energy sector deteriorated and it didn’t match up with Bank Nifty.

10 yrs performance [Daily SIP Investment]

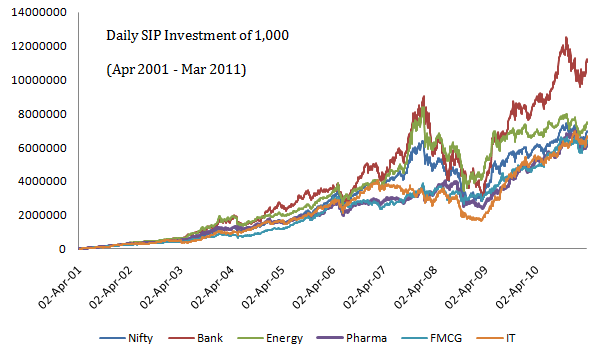
The chart below shows the sectoral performance + Nifty for a daily SIP investment of Rs 1,000 in last 10 yrs  .
SIP Sectoral performance 10 yrs

Observations

  • The most insight full thing you can see here is that all the sectors other than Bank Nifty has given very close return if one had done SIP regularly . This shows both, the power and weakness of SIP . You can get more returns out of bad sector and less return from the strong sector .
  • IT sector performed very badly after the crash , but in the recent bull run , it has performed very well and gave superior upside .

10 yrs CAGR returns for lump sum and SIP investments

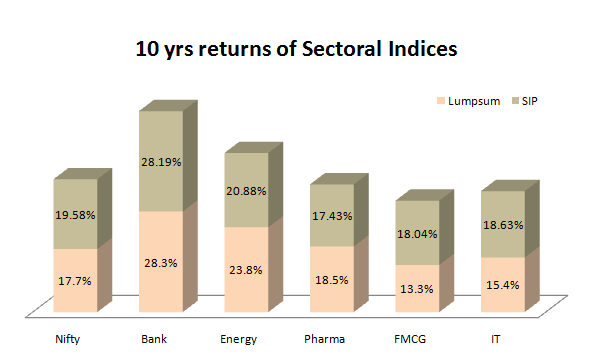
The following chart gives you CAGR return of last 10 yrs for both lump sum and SIP . Note that the values are approx only .
SIP and lumpsum returns of Sectoral indices in 10 yrs

5 yrs performance [Lumpsum Investment]

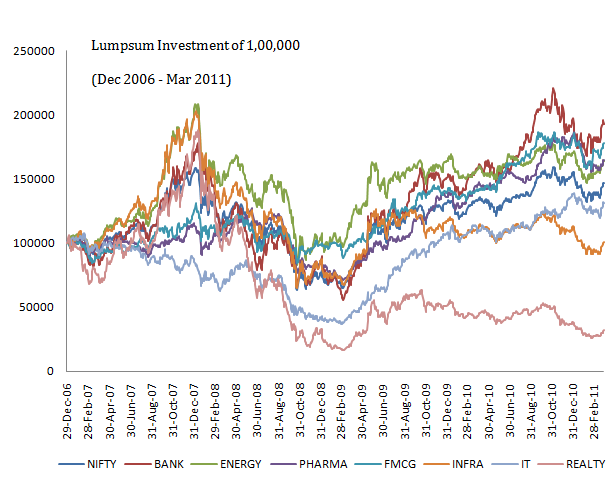
Now we will look at 5 yrs performance of various indices . The chart below shows the sectoral performance + Nifty for a lump sum investment of Rs 1 lac in last 5 yrs  .
Lumpsum Sectoral performance 5 yrs

Observations

  • Bank Nifty still leads the pack , the other sectors too performed good and are marginally poor . Nifty , Pharma and Energy come next best .
  • Reality sector was one of the best performers till 2007 , but then its performance went down and its gave a very high negative return on CAGR basis . When other indices gave above 10% returns on average, Reality index averaged -20% CAGR return .
  • Energy index has not made much movement in last 2 yrs from 2009 – 2011 , whereas Bank Nifty has doubled .

5 yrs performance [Daily SIP Investment]
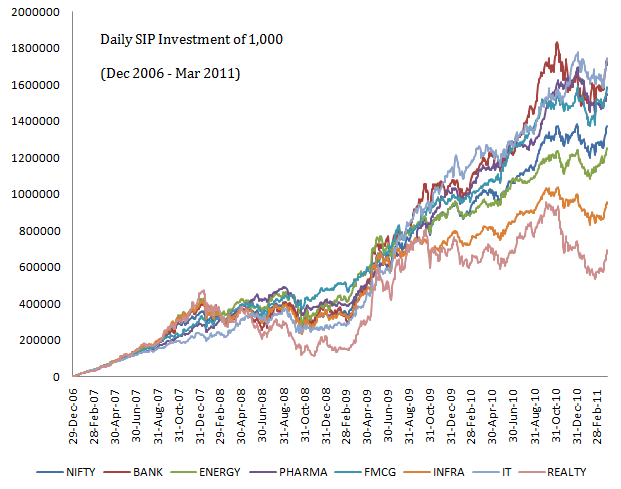
SIP Sectoral performance 5 yrs

Observations

  • On 5 yrs SIP basis , IT sector has clearly outperformed other sectors and it was very consistent in that . Bank Nifty comes second.
  • Reality and Infra sector has performed badly and given close to ZERO return in last 5 yrs .

5 yrs CAGR returns for lump sum and SIP investments

The following chart gives you CAGR return of last 5 yrs for both lump sum and SIP . Note that the values are approx only .
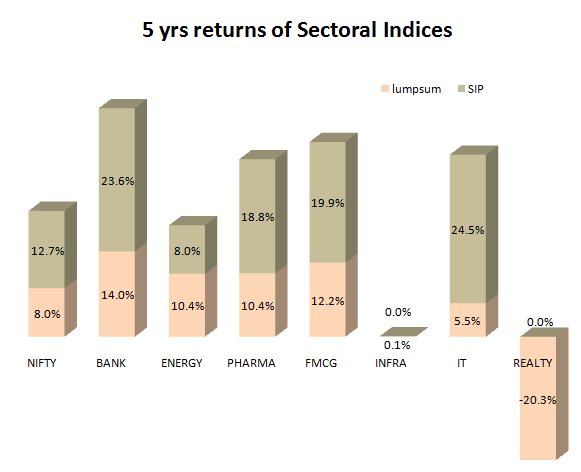
SIP and lumpsum returns of Sectoral indices in 5 yrs

Please share what other information were looking from an article like this . Share your comments about the article .

How did you like the information ?

Is Stock Market Crash on the way ? [ 4 charts ]

Did you invest in ELSS recently for tax saving? If you have done that with the intention of getting quick great returns in 3 yrs and then liquidate the funds, you might not like this article. Indian stock markets are seeing some serious sell-offs in the last 1-2 months and there are some reasons for it. In this article we will look at some indicators which can help you take further decisions.

Stock Market Crash India

Why Nifty Started Falling from levels of 6300?

You should ask why shouldn’t it fall? Everyone has bad memories about markets and 6300 in nifty is a level from where we saw one of the biggest crashes in 2008. A lot of investors had a really bad experience at that point, as they were stuck at that point and could not sell-off in 2008. They kept their stocks with them in the hope to sell it off next time when the market reach the same levels. This is what exactly happened when markets reached the levels of 6300 recently, everyone said .. “BOSS. I am now getting out of markets as I have reached my previous levels, No matter what happens next, I am just out !”, which is very natural and well-known phenomena is markets.

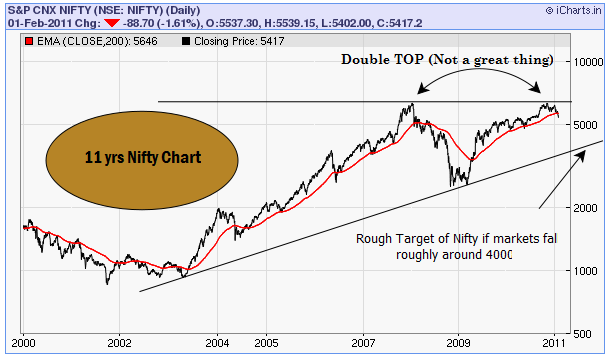
When the majority of people do this,  there is serious sell-off suddenly. In technical terms, this phenomenon is called Resistance and we can see a probable double TOP at the level of 6300, not a very great thing for people looking to BUY :). I say probable double top because it will only be confirmed after markets break the target of 5350 at nifty (got this tip from Nooresh Merani). It would be a bad situation to watch ours for. Look at the last 11 yrs chart of Nifty below.

Stock Market Crash

3 major indicators indicating the fall in Indian Markets

There are some serious events which are worth looking at. Let’s look at them

1. FII’s are selling

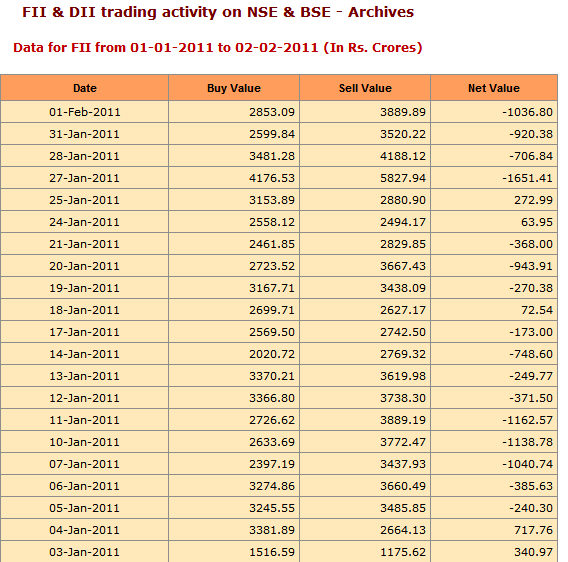
The biggest reason for the current market fall is due to FII (foreign institutional investors) selling off. Suddenly American and European markets are looking better than Indian or Asian Indices. Note that US markets are rising from last some months and Europe has outperformed Indian markets by 20%+ in Jan alone. FII’s have sold a lot of in the last 1 month, below is the data are taken from the NSE website.

FII sold in Indian markets

However, not everyone agrees to this argument. “FII’s have invested around 50,000 crores in Indian markets from the point when Nifty was around 5,400 last time, which was around Aug 2010,  However FII’s have sold taken out just 15% of what they invested, and right now we are at the same levels , so still lot of FII’s money is lying around.

So, the biggest reason for the fall is the fear of rising inflation and interest rates and the way it will affect our markets and economy in coming days”- says Deepak Shenoy of Capitalmind.in .

2. Markets broke its 200 day EMA + important Support points

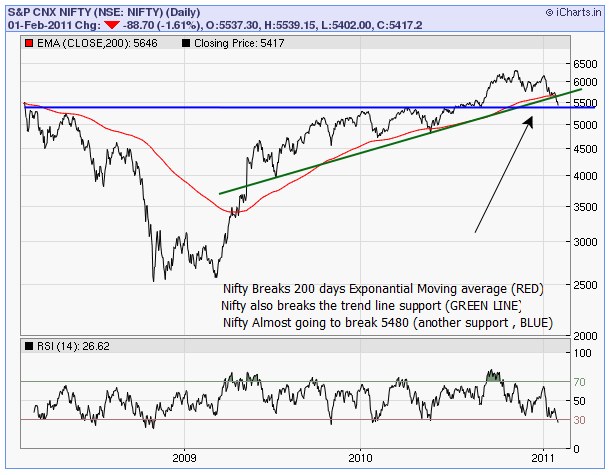
This is not a small thing to ignore, breaking of 200 EMA is a significant event, and it has happened only twice in last 2 yrs, but it bounced back from that point, However, this time it has broken it again and got below it and not bouncing back. Incase it does not bounce back above it, It’s not a comfortable situation. So if you know GOD personally, please pray.

Look at the 3 yrs chart below which shows the 200 EMA breaking and other trend line breaking. Learn more about Support and Resistance and other important things related to stock markets here, here and here

Should retail Investor Buy right now for the long-term?

I had a talk with Nooresh Merani, a technical analyst at Analyse India, and he feels that the main panic button is still not triggered.

As per him – “The major point comes at 5350 on Nifty which is very crucial, we can not say we are entering a Bear market unless market crashes below the levels of 5350. If that is broken, then there can be further weakness in Indian markets and sell off, However if markets bounce back from these levels of 5350-5400 and go up further, it would be safe to buy only if markets move above 5700 levels , unless then better to be high on cash and not take any action. If markets can move above 5700 again , it would be a great idea to deploy cash and see levels of 6800-6900 on Nifty” – Nooresh Merani (blog)  .

Stock Market Crash

3. Nifty PE touched 25 and now moving down

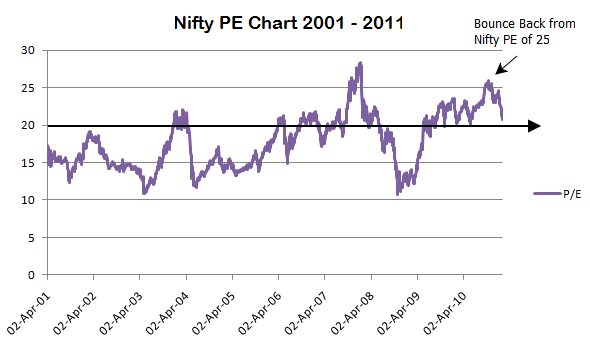
Please read this post on Nifty PE incase you have no idea what is it. Nifty PE has been a good indicator till now to show the over-bought and over-sold regions and we can expect it to be a good indicator. In the last 10 yrs, It was the second time when Nifty PE went beyond 25, Only in 2007-2008 it was around 27-28 and even body knows what happened after that. Even now Nifty PE touched 25 and now it’s moving towards 20, I would not be very bullish for long-term in this kind of scenario. But there are cases where it has bounced back from 20 again to move higher, so keep it as a possibility. See the chart below which shows you the Nifty PE movement in the last 10 yrs.

NIFTY PE indian stock markets

Conclusion

Technical analysis is an art of reading charts and there are some serious concerns seen in the chart, however, it’s not at all recommended to take the words on rock and believe it blindly. This article and the information here are to facilitate your decision-making process. By no means, this article suggests you sell off anything.

If you are a long-term investor with monthly SIP’s running in Mutual funds, you should better concentrate on what you are good at in life and keep your SIP’s running. Only traders or short-term investors trying to catch the market movements should take decisions based on the information provided. Also if you are going to invest in markets or mutual funds for 1-3 yrs and are a first-time investor, you should understand that there is a possibility that you do not get much out of markets in returns.

Comments please. Give your comments on the charts above and what do you think should be the next move? Let’s not predict, but prepare ourselves for whatever happens next.

Note : Nifty was at 5526 at the time of publishing this article .

5 mistakes I made in my first stock market Investment

Do you remember your first stock market trade and how you behaved at the time? Just like you, even I, have made some really stupid mistakes in stock market Investment.

Today, I would like to share some mistakes (only the big ones 🙂 ) which I made during my first trade in stock markets. Its worth discussing, how I could have avoided those mistakes. You can learn from them too!

investors mistakes

Mistake 1 : Buying on Others Recomendation.

27th Nov 2007 : I had just got my spanking new trading account and I was so eager to trade and make lots of money(How to start in Stock Market) .

I saw an Orkut community recommending GTC India – a “Buy” Recommendation. There were several good reasons discussed there, and an extrapolation on how it can reach from current price of 600 to 2000 in some months.  It looked like a “don’t-miss” trade. I bought 10 shares @ 560/-.

Mistake : Buying only on recommendation and not analysing the opportunity well, over relying on others recommendation, buying a company which I do not understand enough .

Learning : Never buy, just on recommendation! Do your own study and analysis. When you buy on others recommendation, you don’t take responsibility if there is any loss, which is dangerous in markets.

Hear others but listen to your self. See other factors like market trends, sector view, global markets, future prospects et al. Once you are fully confident that its a good trade and you feel comfortable with it… go for it.

Mistake 2 : Being too greedy

After 3 days : Just after I bought the shares, it went up from 560 to 800 in 3-4 days. I thought that its moving as expected, and bought 10 more shares at 800. Within another week, it went up more to 950! Now, I was flying!

I bought 10 more shares @955 again, to reach the target of 1500+ . My average buy price was now 772 . I was feeling little bad for not buying 30 shares directly @560 in the start .

Mistake : Greed! Pure & simple… This is a very common mistake, a big mistake at that – so big that it will be among the top mistakes investor and traders do. Buying more wasn’t wrong. It was the intention behind the buy. There is nothing wrong in increasing the position once it moves to your target, but it has to be backed up with strong reasons and study.

It should be a trade with high probability of success. In my case, it was not. It was just a recommendation from someone in an orkut community, with a couple of lines, explaining, why it will go up .

Learning : There was no need to buy more shares that point in time. I should have just sat back and watched. The Stock market is just like our life, you need to have a level of satisfaction in your life and stock markets.

If you want more and more and more, you might not get anything. In fact, you can lose heavily. Because of greed, I invested more than I could afford to lose. I took an unwanted and unaffordable risk, because I only saw profits and never the potential losses.

Mistake 3 : No profit booking on Time

After 1 week : The prices were not moving now. It was going up a bit then coming down again and was stuck in a range of 900-1000. It went up to 990 once. For a time being there was doubt in my mind if it will not move up to 2000 and will return back to my buy price levels.

Mistake : No profit booking. There was a sharp rise in shares price from 550 to 900 in just 2-3 weeks and that is rare. It doesn’t happen to every stock, it was an excellent return, but i did not book profits.

Instead of making the best of the situation and taking the (not so bad) profits, the market was offering me,  I wanted more and more and lost even what I was getting.  The reason was Greed, again.

Learning : The better thing to have done, was to book profits, at least partially… Situations change in markets, I never checked on any news regarding the company after i bought the shares, and I was never updated about it. Every time you get some good profit, its a wise idea to at least book some partial profits out of it (Unless you have really strong reasons to hold it for long) .

Mistake 4 : Having Ego

In next 1 week : Prices now started coming down. It came to 900 first, I was scared and told myself that I will book profits once it goes back to levels of 950+. It never did! Then it came back to 800 and I regretted not booking a profit at 900 and said to myself again “I will book it for sure when it comes to 850.”

Guess what? It never did! Then it went up a bit again and went up to 850 . I forgot my promise to myself & allowed my greed to take over my promise. It went down again after that and now it was near my average buy price. This was the time I was feeling, “What a big fool am I, for not booking Great profits!”

I could have sold it at 0% profit, & yet I didn’t, because I would look a fool in my own eyes. Why Stock Markets Attract and Look Easy

Mistake : Ego ! Fear of losing part of profits, another mistake was the fear of not making any profits and fear of losing some money . Fear! Fear! Fear!

Learning : “When your boat starts sinking, you don’t pray… just jump” Once you are doubtful, surrender to markets wish. See what markets are showing you, not what you wanted to see. Markets are supreme and no one can be smarter than the markets.

Leave your ego at your home, when you go in front of Markets. The markets tell you what’s going to happen, not vice versa. Accept that you are wrong and you made a mistake. Then move on.

Mistake 5 : No Patience

After few days : Then the prices started falling and plummeted to 600 (my original buy price). Now I was in loss. I was proven wrong, but I just couldn’t accept it. I kept trying to prove myself right by holding it and hoping it would come back up. Yea, you know… It never did 🙂 .

It went lower and lower and lower and I was just praying &  hoping that it’d return back to a level where I’d be happy to sell it. It never did! It went up to 300 and I sold it all in frustration. Then, I saw it go down to 250 and bounce back to 500! Now, I was feeling like I was cheated by the market for not giving me the right opportunity to exit.

Mistake : Impatience, Fear  and not cutting my losses short. I exited at a very bad time, at almost the lowest price then. There was an opportunity for me to exit at small loss, but taking a loss hurts the ego and it did. Not cutting my loss in time was the result, of my not defining my loss early enough.

I should have had thought of it earlier. Then, I’d just pull a trigger, when it reached that level, without emotions. Fear overtook common sense, Fear overtook logic .

Learning : I should have defined my Target and Losses before taking the trade. I should have been realistic and logical. I should have waited little mo.re time and then exited at a better price. I should have consulted someone, better than me (At that time though, even a street dog could have given a better advice than me :))

Price of GTC INDIA after this Incident : It never went above my price levels after that and went to Rs 55 after couple of months , even today (Nov , 2010) , its hovering below Rs 65 only .

Conclusion and Summary

My first trade was not at all planned and “no plan” is “a plan to fail”. Fear ! Greed ! Emotion! Ego ! Impatience! These are the elements of Failure in Stock markets. Manage them well and you’ll do better !

Making sense of the market through Sensex at MRP

In the previous article, we looked at Stocks@MRP and how a stock can have a price tag. Moving further, we now discuss how the concept of Stocks@MRP has been extended even to the benchmark index :

Sensex . Also there is an example of one stock each considerably above and below its MRP. The inherent volatility in the stock markets makes stock investing to be perceived, by many, as a gamble. However, the Stocks@MRP can help us get a very good idea about the worth of a stock.

Once we know the MRP of a stock, we should buy it at a 50% discount to its MRP and sell it if goes considerably above its MRP. Then, how does Sensex@MRP come into the picture? And why do we need to find out the worth of the benchmark index as well?

Sensex markets india

Going back to History

Let’s jump back a bit in time. It’s December 2007. The Sensex is close to 20,000. The media is going gaga over the Indian economy and the movement of Sensex (up by 55% in just 9 months) and is saying that the next stop is 30,000. Everybody is eager to jump onto the bandwagon.

Fortunately, you have been a part of the rally since the beginning and have seen a considerable rise in your holdings. So, what do you do? Do you sell off and book your profits? Or do you wait? After all everyone is saying that this is just the beginning.

You wouldn’t want to look like a fool selling too early and missing out on the further upside, would you? You stay in and within a few months, you regret your decision.

The market crashes (falls by 50% in 1 year), your stocks tumble and a large portion of your wealth is wiped away. All your companies are still doing well, they are still fundamentally strong. Yet, you have suffered because of the market’s over reaction to the sub-prime crisis.

You may have not lost your capital, if you bought your stocks at a discount to the MRP, but your profits have definitely vanished!

Sensex@MRP concept

Warren Buffett, one of the greatest investors in the world has said, “Be fearful when others are greedy and be greedy when others are fearful”. But to do this, you need to be aware when the others are being greedy and when the others are fearful. And this is the quest that exactly led us to finding Sensex@MRP.

The market represented by Sensex is known over react, to both positive and negative news. Be it national or international politics, capital inflows or outflows and favorable or unfavorable monsoon forecasts; the Sensex fluctuates widely because of these.

Even though Sensex is comprised of just 30 stocks, chances are that if these big names get hit, a majority of the other stocks also get clobbered. This thought led us to the logical extension of finding Sensex@MRP so as to enable investors to enter stocks at bargain levels and help them exit when things start getting over-exuberant!

The Sensex companies are some of the biggest and most well known names in the country. They are amongst the favourites amongst the institutional investors and hence are highly liquid. One can then expect these stocks and as a result the Sensex to trade close to the fair value i.e. MRP.

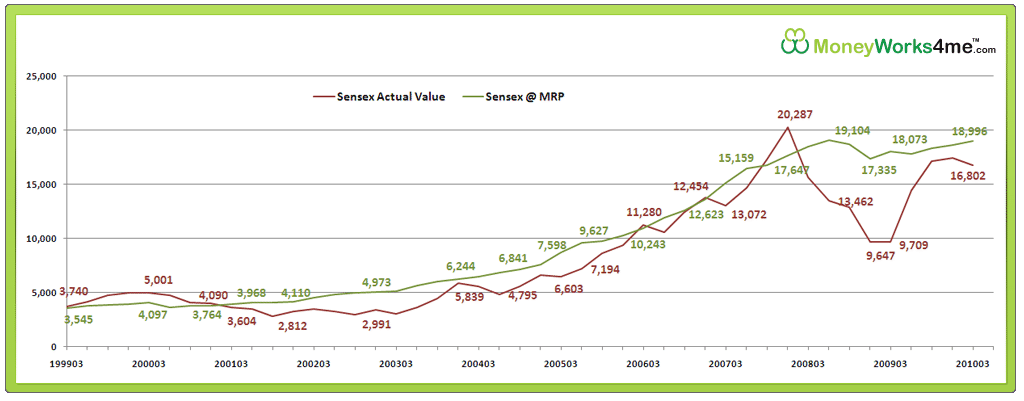
However this has seldom been the case. On quite a few occasions, the market has become irrationally exuberant or highly depressed. Knowing these phases of the market can help you become better investors. The graph below gives you a comparison of Sensex@MRP values plotted against actual Sensex values for a period of 10 years beginning March 1999.

Click on the graph below to have a look.

Sensex at MRP

Movement in Sensex along with its MRP

  • March 1999 to December 2000 saw Sensex quoting consistently above its MRP. Many of us will remember this time as the Technology boom. During this time Sensex was trading at a multiple of 30 times earnings. As the Sensex was clearly above Sensex@MRP, this was a good time to ‘Sell’. As expected a correction took place and within a year, Sensex was trading 15% below Sensex@MRP.
  • June 2000 to March 2003, saw the Sensex trading at around 30% discount to its MRP. The earnings for the Sensex companies were stagnant during this period but clearly the market was undervaluing them. In hindsight, this was a good period to enter the market.
  • Post 2003, earnings of the companies entered a high growth phase and this continued till March 2008. This is evident from Sensex@MRP which increased from 6000 levels in 2003 to 19000 levels in March 2008. But the market seems to have over reacted during this phase with the Sensex crossing the Sensex@MRP in September 2007 and December 2007. Infact December 2007 saw an over valuation of as much as 15% – a clear sign to Sell and get out.
  • As the sub-prime crisis and the fears of a global meltdown spread, Sensex crashed and reached 9000 levels in December 2008 and March 2009. What is interesting to note here is the fact that earnings of the Sensex companies had not suffered much. Sensex@MRP, which is driven primarily by earnings, was in the 17000 levels. Thus the market was without a doubt over-reacting and Sensex was quoting at almost 50% discount to Sensex@MRP. This was the buying opportunity of a lifetime.
  • Within a couple of quarters, Sensex zoomed up and traded close to its MRP. Considering March 2010 quarter results, Sensex@MRP comes out to 18,996. This means currently Sensex is just about 4% below its MRP. Thus, Sensex is close to its fair value and as investors we need to tread with caution. Quite a few stocks are creating 52 weeks highs and it is difficult to find value picks at the current moment. Infact, some stocks are currently trading well above their MRP and one can consider selling them.

Reliance Infrastructure Example

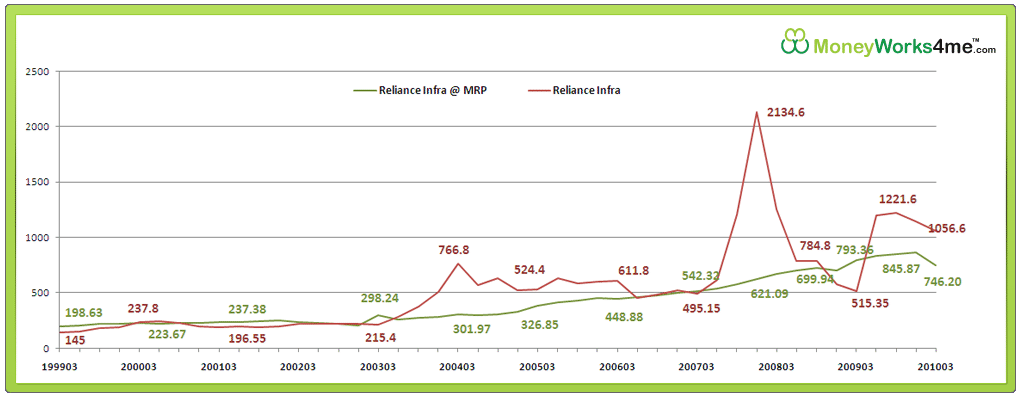
An example of a company quoting considerably above its MRP is Reliance Infrastructure. In 1999, Reliance Infra was quoting at a discount of 20%. It crossed the MRP in year 2000 and remained close to MRP till 2003 inspite of an inconsistent financial performance. Its earnings infact witnessed a drop in 2002 and 2003.

The company’s performance improved post 2003 and the price zoomed above its MRP. In 2004, the stock was quoting as much as 150% above its MRP. This seemed like a sell signal but the stock rose further to unimaginable levels in 2007. In two quarters i.e. from June 2007 to December 2007, the stock more than tripled.

The irrational exuberance of the market was visible as the stock quoted at a PE multiple of 50 at Rs. 2130. The price crashed soon and in March 2009, the stock was quoting at a 35% discount to its MRP. Again, the prices corrected and the stock is currently trading 50% above its MRP of Rs.746.

Reliance Infrastructure

However, even with the market at 18,000, there are a few stocks which offer good value. Let’s take a look at a Sensex company which is currently quoting at a discount to its MRP.

Bharti Airtel Example

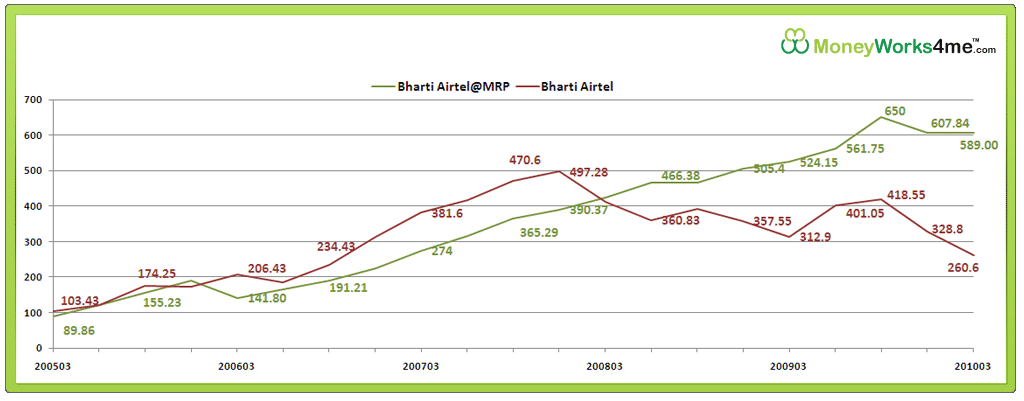
Bharti Airtel currently at Rs. 327 is quoting at a discount of 44% to its MRP of Rs. 589. Click on the graph below to take a look at Bharti’s historical valuations. Except for the initial years, Bharti has always traded above its MRP.

Leadership in the telecom industry coupled with high growth in the mobile market, helped the company record great earnings growth over the years. However, since March 2006 as competition intensified, the premium commanded by Bharti has decreased especially after Reliance Communication’s entry.

Further, the telecom sector has been seeing all sorts of problems including an intense price war, detrimental policies and very recently audacious 3G and broadband license bids. To add to this, Bharti also completed the acquisition of Zain Telecom which led to questions being raised about its financial position.

All this led to Bharti tumble to levels seen in March 2009. However, over the last few weeks, Bharti has picked up quite a bit. Bharti’s MRP works out to Rs. 589 considering an earnings growth rate of 18% which is substantially lower than its past growth rates thus making it a value pick.

Bharti Airtel
Finally, how effective is this concept of MRP especially as it is based on past data? After all as they say past performance is not a guarantee for the future, is it? But as we saw in the graphs, over a long term, stocks tend to move towards their MRP.

So, the rule of buying at a discount to MRP (ideally 50%) and selling above MRP would ensure good returns. Once the stock crosses the MRP, the probability of a correction increases. There is however always the chance of error. There is a possibility of the stock running considerably above the MRP as seen in the case of Reliance Infra.

You may miss out on the upside fuelled mostly by sentiments rather than earnings. But provided you buy the stock at a 50% discount, you would already be sitting on handsome, riskfree returns and hence would rather let this risky upside pass!

Now, Stocks too have a MRP Tag

Have you ever asked what is the MRP of a stock ? I don’t think so !

The reason many investors shy away from investing in stock markets is because it seems to be a gamble. With the markets fluctuating every day, dropping or rising at the slightest bit of concern or euphoria, one is bound to be wary of putting one’s hard-earned money here.

And most of us experienced the worst of this volatility during the market crash in 2008; some of us are still recovering from its aftermath. So, how can we ensure that there won’t be a repeat of this scenario? How do we ensure that we do not lose our shirt at the market and make our hard earned money grow into wealth?

We all know that it is important to invest in fundamentally strong companies.

But what is equally important, if not more, is to invest at the right price. But how do we find out the right price for stocks?

Whenever we shop for anything, we are guided by a MRP tag on the wrapper or pack. Unfortunately, we do not have such a MRP tag to guide us when we buy stocks, do we? Well, now you can even have a MRP tag for stocks!

Stocks@MRP can be a great tool for investors to make sensible buy and sell decisions based on fundamentals and not on market sentiments. MoneyWorks4me, have labelled stocks with a MRP tag; something which each one of us can understand and relate to.

What is Stock@MRP based on ?

This price tag for stocks is based on the factor which primarily drives the price of a stock in the long-term – the earnings power of a company. The concept of MRP is based on the fact that, while in the short term, stocks might be affected due to news, sentiments, FII movements etc. over the Long term, the market will invariably reflect a stock’s intrinsic value based on its earnings.

MRP is a tool which helps you to gauge whether the market is under reacting or over reacting to these. As sensible investors, we would be well served if we bought stocks at a considerable discount (ideally 50%) to their MRP and sold off stocks if they are priced considerably above their MRP.

To verify whether this method could have worked well during different time periods, good times as well as bad times, we back tested it for the period 1999-2010 and found that the results are quite gratifying.

Let’s understand this concept with the example of Wipro.

The graph below shows two lines. The Red line is Wipro’s actual stock price for the period 1999 to 2010, whereas the green line is Wipro’s MRP for the same period as calculated by us based on its fundamentals.

The graph shows that Wipro was considerably overvalued for the period 1999-2001 during the Tech bubble. The company was quoting great numbers with a 60% growth in earnings (9 year CAGR growth rate) from 1990 to 2000. Add to it the euphoria of anything related to the IT industry during this period and you see Wipro quoting at as high as 400 times its earnings.

On the other hand, the MRP offers a better view on the intrinsic value of the stock based on its earnings. Not surprisingly then, as the bubble burst the price rocketed down and reached its MRP. From 2001 onwards, Wipro’s price remained close to its MRP, thus indicating that the stock was more or less fairly valued.

Wipro quoted above its MRP values from March 2005 to December 2006.

In March 2006, it was trading at as much as 30% above its MRP. Thus, it is evident that the market was expecting above average earnings in the next few quarters; a difficult thing to achieve continuously.

The EPS for the company grew at an average of around 8% during this period on a Q-o-Q basis. This was a good time to sell the stock as the price rise was not supplemented by a huge rise in earnings.

Stocks at MRP from Moneyworks4me.com

However, things started turning south for the company post december 2006 with the PE contracting. The company registered a Q-o-Q drop in EPS in June 2007 and it seems the market over reacted to this with the price reaching as much as 20% below the MRP. The company’s earnings registered a drop, again, in June 2008.

Also, after reaching a peak in January 2008, the Sensex started plummeting with the fear of a global economic recession on the cards. Wipro was available at a discount of as much as 60% in December 2008 and March 2009; a clear buy indication.

Within 2 quarters the price of Wipro reached close to its MRP giving an investor, returns of around 50%. Today Wipro is quoting at around 10% discount to its MRP and therefore one should wait for it to come to lower levels to enter. (Read Nifty PE analysis)

Margin of safety

We all know about great value investors like Benjamin Graham and Warren Buffet, who insisted on always buying stocks with a margin of safety. However, it becomes difficult to confidently ascertain what the intrinsic value of a stock is and hence we end up paying a premium for a stock instead of buying it with a margin of safety.

Stocks@MRP helps you to ascertain the intrinsic value of stocks thus ensuring that you always buy stocks which are at a discount to the MRP. As seen in the case of Wipro, following this strategy would have yielded great returns and that too at minimal risk .

Outlook Profit magazine has published a special story on this concept titled “The Right Price” in their issue dated 9th July 2010. The concept can prove to be a very useful tool for investors, enabling them to enter stocks at bargain levels and exit when things start getting over-exuberant!

You can read more about this concept on our blog Stock Shastra. In the subsequent post, we will see how this concept can be extended even to the benchmark index Sensex. We will also take a look at a few stocks which are trading considerably above or below their MRP.

This is the first of a series of guest posts by Nikhil Kale from MoneyWorks4me.com.

Let’s Decode Warren Buffet Rules of Investing

In this article, we discuss two rules of Warren Buffet and understand their essence. A lot of people in the stock market quote these two rules of his, but the majority of them don’t even understand what they mean exactly, and what Warren Buffet actually tried, to communicate with his rules.

He mainly stressed on “Controlling losses” which is the most crucial point, when one deals with Equity. This can be directly investing in the stock market or through Equity mutual funds. Let’s look at them.

Warren buffets rule of investing

Warren Buffet Rule of Never Lose

Warren Buffet says, there are two rules in the stock market

  • Never Lose Money
  • Never forget Rule #1

Most investors have heard this and have read it a number of times. But for the most part, they’ve taken these words casually and feel that they are just funny lines. How can one never lose and how can that be the single most important rule in the stock market?

The real meaning of these two rules lies behind those words and if we dig a little deeper, we will understand the real value of those rules.

Let me decode it for you here. Read it with all your concentration & focus. Those two rules, really are, worth everything in the stock market.

Stock Market and Warren Buffet

What Warren Buffet really means when he says “Never Lose”?

No one in this world, wins all the time. One loses frequently, and this is true in stock markets also. No one can ever trade or invest in such a way that he/she never loses.

What Warren Buffer actually means by “Never Lose” is that every time we lose, it has to be an insignificant loss. The quantum of loss, has to be so limited or small, that It’s not going to affect us psychologically. If we make a profit of 100 every time and lose 20 or 30 every time we lose, we are actually not losing, if that’s your series of trades.

If you win 100 and lose 20, you are actually only winning 40 for every trade in series of 2 trades… But if you are letting your losses mount and never controlling them, then you are really losing and then those losses can impact you in a big way…

What he means when he says “Never forget Rule number 1”?

By this, he wants to emphasize on how important controlling losses are. Another one-liner of his, that in the stock market and in life you don’t need to do a lot of right things as far as you are not doing a lot of wrong things.

So, as far as you remember that controlling your losses is the topmost rule, you just need to be an average investor or trader and the power of compounding will take care of rest for you. I’ll summarize those rules again for you and what you should actually read in them.

Rule 1: Never Lose (Control your losses, cut them soon enough, so that you don’t feel them)

Rule 2: Never forget Rule 1 (Controlling your losses is the topmost priority you should have. As long as you are able to take care of it, other things will take care of themselves).

Let’s take an example – There are two investors, Ajay and Robert, who both make 1000 trades in their entire life, 500 losing trades and 500 winning trades. Ajay makes a profit of 6% on winning trades and a 3% loss on losing trade.

He has $11.9 Billion dollars in the end. On the other hand, Robert concentrates more on controlling his losses (and hence is able to control his losses up to 1% on average per losing trade) and also makes 5% on winning trades. At the end of his career, he would have $25 billion.

Conclusion

Its only controlling losses which made Robert more money than Ajay. Remember this, you need to concentrate more on “not messing it up” rather than making it “rock”.

Investing sensibly in the stock market

The common view of the stock market is that, it’s a place for gamblers and risk takers. Only if you have the capital, and the nerve to take risks, should you invest money in the stock market. Otherwise one is better off staying away from the stock market and putting money in safe fixed deposits. The truth is far removed from myth, if one looks at the stock market with a different perspective, and avoids the hype and hysteria associated with it. Let’s look at different aspects of investing in the stock market.

Let start with the basics – What is the stock market?

The stock market is a place, where buyers and sellers meet to buy and sell companies or rather small pieces of it. That’s all there is to it! Nothing more, nothing less! The small pieces are called shares and they represent a really small ownership of the company. Owning such a share, entitles the investor to his or her share of the profits, the business makes. This generally, is paid out to the investor, as a dividend. The management does not give out all the profits to the investor, of course. They retain some portion of the profits to re-invest and grow the business. Learn How to start in Stock Market

So how should one invest?

If you agree with the above definition of the stock market, the idea of investing in the stock market boils down to investing your money in a select group of companies. If the purpose of an investor, is to make a decent return on the money invested by him, then he should choose companies or businesses which are sound, consistently profitable for a long time and run by shareholder friendly management.

Finding a good company

investing in stock markets

Let’s explore the above statement a bit further. The long-term return for a shareholder, (where long-term is 5 years or more,) equals the underlying returns generated by the company. The returns for a shareholder can fluctuate from year to year based on the market moods and sentiment, but over the long run, investor returns always track the returns of the company. If the company can earn 20% on its capital, then the investor will make around the same returns over the long-term. Thus, we now arrive at the first criteria for successful long term investing, i.e., To make above average returns, one should invest in above average companies.

The above criteria is not a revelation to most people. However very few people want to follow the obvious as they think, that there’s some hidden magic in the stock market.

So how does one find the above average companies?

Look around you. Do you see products which have been around for quite some time and are used by a lot of people? Find out the companies behind them… That would be a good place to start. (Cue, the groans — I never said investing in the stock market does not require work. 🙂

Analyzing the company

Once you have identified a few names, the next step would be to get the annual report of the company and browse through it. The mention of reading an annual report sounds really daunting or off-putting to most people. However if you bring yourself to do it, it will place you ahead of 90% of the people in the stock market! The idea of browsing through the annual report is not to become an expert at it, but to get a feel for the nature of the company. One can focus on some of the following sections to see if the company is worth putting your money in,

Management discussion and analysis – This is the section where the management describes the business and lays out the plan for the company.

Profit and loss and balance sheet – This is the section which tells you, if the company is making a profit or not, how much debt is held by the company, the amount of dividend etc. If you come across a term you don’t understand – search for it on the internet or talk to a friend or someone with a background in finance.

A few important factors should be checked when analyzing the annual report. A short list of these factors can be

  • Is the company profitable and has it made profits consistently in the last 10 years?
  • Has the company paid dividends consistently in the last 10 years and has the dividend increased over the same period?
  • Has the company kept the debt equity ratio constant or better yet reduced the debt?
  • Has the company been able to introduce new successful products in the market?

An example

Let’s look at an example – Asian Paints. This is one of most well-known companies in India. This company has been the number one paint company for the last 20+ years. The company’s products like tractor distemper and emulsion, apcolite enamel, Apex exterior etc are well known and are widely available. The company has been in business for over 30 years and hence we can be confident that the company has done something right consistently to be the no.1 paint company in India.

The annual report shows good performance over a long period of time. The ‘ten year review’ in the annual reports shows an increasing profits and dividend over the years. The company has used these profits to reduce the debt, pay out an increasing amount of dividend and re-invested the balance in the business to grow it over the years.

The above performance has been reflected in the share price too. An investment of Rs 1000 in 1998-1999 would now be worth around 19000 which translates to an annual return of around 31%! And this doesn’t include annual dividends!

When to buy?

The immediate question which comes to mind is when should one buy the stock? There is an army of people out there, whose job is to advice investors the exact time to get in and out of stocks. I would personally say an investor would be far better off if he or she switched off the TV and ignored the advice of these so-called experts. If one is able to find a stock like the one above, the best approach is to invest in the company on a regular basis. If one can save Rs 2000 per month, then go ahead and invest 6000 Rs every quarter. A regular  program of investing in good companies on a regular basis, while ignoring the noise and chatter of the stock market pundits, will give you very good returns and also good sleep at night.

Conclusion

So… what’s the catch ? The catch is — us! A lot of investors like to get all excited and thrilled, when investing in the market. They want to chase the hottest stock, so that they can boast about it to their friends. At the same time, they ignore the gems lying right in front on them.

Investing is simple, but not easy. If one can find a few good and high quality companies and invest in them on a regular basis while ignoring the noise and chatter in the media, then that individual is likely to do well and have a really good amount of money secured for his or her retirement.

This is a guest article from Rohit Chauhan. He writes about his thoughts and analysis of various companies and industries and how to apply value investing principles, His blog is http://valueinvestorindia.blogspot.com

Review of Stockezy.com , A Social Investing Community

Ever thought of a Social Investing community website in India . I am glad to review Stockezy.com today which has grown to a popular stock investing community in last couple of months in India . Stockezy.com is one of the best online places you can get education, stock tips , great links for other financial resources (mainly stock market related) . Let me point out main features of this website which you can use to increase your knowledge and also contribute . There are different sections in Stockezy , Below is a short description of each of them .

Stock Picks : You can stock picks from members on different stocks in indian stock market . With every stock pick there are important things like  target price , target date , Stop Loss . There are picks for Buy and Sell both .  Link

Opinions : This is a section where you are read opinions of different members on variety of topics from market outlook , stock movement , Short term view , Long term views about something . In short this is a place where you can get to know what a person feels about a topic . There are different categories for opinions so that its easy to find out some opinion . Link

Questions & Answers : You can consider this as a forum for questions and answers , If you have any question on some stock , market direction or any other similar thing , you can just post a question and anyone who wishes can reply to your question . You can see it as a thread which discusses some idea . Link

Portfolio Tracker : This is one of my favorites , this is a place where you can test your investing skills and buy and sell in real time, Its a great platform to test your abilities before you enter the market . You can get your statement which shows your Profit/loss and all the transactions summary in short . So if you are a new investor who is going to enter the market , its an ideal place to test out your strategies and skills . Link

Share Links : This is a very nice addition recently on Stockezy.com . You can view this as a twitter of Financial Markets . Different Financial blogger post links to variety of topics here with different categories . Even I post my personal Finance posts there .  Link

[ad#big-banner]

Other Features

  • You can subscribe to RSS feeds of any particular sub features like  Stock Picks | Opinions | Answers .
  • You can watch out different top traders for different Time frames like Top day trader , Top medium term Investors etc
  • Gives you a list of Most active investors and top pickers , which gives you a good idea of whom to listen and whom not .

Stockezy is a fast growing Investors community with close to 1 million page views a month , You can get lots of great bloggers like Nooresh Merani , Arun the Stock Guru and other famous bloggers.  If you wanted a platform to show your investing skills , Stockezy is the place you belong to . Register to Stockezy using This Link

Further Improvements

There are couple of things which can make its much better . they are

  1. An online  technical Analysis Software system which users can use if they wish . There are many investors who like to technically analyse a stock and hence its a much have .
  2. More data on Derivatives segment . there is lack of quality data on F&O segment , so it can add the segment for that .

How should you use Stockezy ?

There are different ways you can use Stockezy.com , if you are new to stock market and want to learn how to to trading , learn the basics, you should join it and start doing the mock trading and see your porformance over a period of time , there are so many great people with knowledge out there who can give you some wisdom , listen to them . Before that you would like to read my ebook on How a newcomer should start in Stock Market .

Comments, Have a look at it and tell me if you like it , Feel free to give your negative and positive feedback .

Disclaimer : I am part of Stockezy.com Bloggers Network

4 Charts which will change your perception about Equity

“Invest in Equity for Long term” You might have heard this sentence from me and others numerous number of times, but have you ever thought, why I say so? Or what is the logic behind that? What is the authenticity of what I say? Why should you believe me?

Hence, I came up with the most time consuming article of this blog till date. Lets explore the world of Equity today and I will show you some amazing numbers and graphs which will change your perception about Equity.

Equity

To make this article Crisp and short, I will show you 4 charts and explain each of them that will show you Power of Equity. Mainly the idea of this post is to show you the return potential of Equity in Different time frames and to find out what is the kind of return we should expect from equity in Long run like 15-20-25 yrs.

For the sake of calculations and source of reference, for almost all of the article I have used value of Sensex Index, but it should be almost similar for any Index Fund, ETF, or a Equity Diversified Mutual fund.

All the below study is based on historical 30 yrs of Sensex data from the year 1979.

1#Sensex Return Chart

Sensex has returns close to 18% CAGR in the long term till date for One time investment and SIP investment.


This chart shows you the CAGR (Compounded Annual Growth Rate) return of Equity after each passing Month. I have manually noted down the Index value for each month starting from Mar 1979 – Sept 2009 (total 350 months approx) and then did some number crunching (actually a lot) and came up with the CAGR returns the index has given for that time frame.

For example: for the month 36, the Index value was 218.82 and my starting Index value was 122.23 (Sensex actually started from 100, but I had a little late data). So the actual return was 23.16% for SIP investment and 20.78% return for one time investment.

So this chart shows that if you had Invested your money in the start and then hold it for a particular time frame then what will be your CAGR return till that point.

The chart shows the return for two kinds of Investment modes: SIP and One time investment. So Blue line shows the CAGR return if you did SIP investment and the RED one shows the CAGR return if you had invested in Start and sold after ‘n’ number of months.

View Data

Points to Note

  • In the Short term, returns have Wild Swings which is the basic nature of Equity
  • In the long run, returns were in the range to 18-23%, where it goes up and down because of Bull and Bear markets. See Nifty PE Analysis
  • SIP performed better than One time for starting 4-5 yrs and then SIP and One time investment were close enough.

2# Nifty Return Chart

Nifty has given returns close to 18% for SIP investment and close to 12% in 12 yrs from 1997-2009 .


This one is similar to the above chart just that it is for Nifty 12 yrs data. This chart shows you the CAGR return of Nifty after each passing Month. I noted down the Index value for each month starting from 1979 – 2009 (total 146 months approx) and came up with the CAGR return the index has returned up to that point.

For example: for month 120, the actual return was 23.33% for SIP investment and 13.17% return for One Time investment. So this chart shows that if you invested your money in the start and then hold it for that particular time frame then what will be your CAGR return till that point?

View Data

Points to Note

  • You can clearly see that the returns kept increasing with Tenure and there were less wild swings up and down with Returns.
  • SIP performed better than One time Investment in all the time frames. See that blue line was always higher than Red one for any given month.

Do you like the articles on this blog, Fill Fan book

3# Absolute Average Return for Each month (Sensex Data)

This shows you how much of absolute average return in percentage terms would you get if you hold your investment for X months.

This is an interesting Chart. It shows how much of absolute return can you expect when you hold your Equity investments for 1 month, 5 months, 50 months or 200 months. I will tell you how each duration is calculated.

Let’s say duration is 12 months, so what I did was that I took all the 12 months time periods like Apr 1979-Apr-1980, Mar 1979-Mar-1980, June-1979-June-1980 and like this the last 12 months time duration Sept-2008-Sept-2009, total of 113 different values, then calculated the Returns for each time frame and calculated the average of those 113 time frames.

I finally got average returns of 12 months Investment horizon (total 113 values for 1-13, 2-14, 3-15 month Index value). So I got a single value of 25.60% for 12 month time frame. This is absolute Return and not CAGR return.

So, if I invest 100, I get 125.60 as return.

Please make sure that you understand that this 25.60% is the simple average of 113 values, there might be many values which may be negative, 0, or may be 100%. But we are more interested in what is the average of all such values.

In the same way the Absolute Average return for 120 months was 672.60%, which means that 100 invested would have become 772.60 in 5 yrs. Please understand that we are just trying to show this as the time frame increase the return potential of equity goes up and up.

Don’t interpret it as the return guarantee for any time frame. It’s Equity, Respect it else it will punish you badly for your Ignorance.

View Data

Points to Note

  • In the long run, the average return has increased
  • For close to 15 yrs, the returns on Equity kept increasing but at a lower speed.
  • from 15 yrs to 29 yrs, the Absolute return increased very fast
  • So the real power of equity comes with long term.
jagoinvestor on Facebook

4# Number of Times the return from investment was Positive for some time Frame (Sensex Data)

This graph shows that how many times an investment has returned positive for some particular time frame, for example for 4 yrs time frame (48 months). There would be many 48 months time frame like Mar-1979-Mar-1983 OR Jan-1994-Jan-1998 or any other date, out of all those 48 month time period, the investment gave positive returns for 87.36% times.

So this graph shows how the number of times went up and up as the time duration was more and more.

For a particular time frame like 50 months, I calculated returns for all possible 50 month window and then saw how many number to times it gave positive return and then divided it with total number of times to get the percentage of times, the return was positive.

So if there were total of 200, “50-month” period and 180 times the return was positive. The result would be 90%. I did this same thing for every time duration from 1-300 months and plotted the graph.

View Data

Points to Note

  • One an average the chart was rising, which kind of proves that Risk of losing in Equity decreases as time duration increases.
  • After 11 yrs, there was no instance when equity return was negative, which means that you invest any time in Sensex index and take your money out after 11 yrs, you will not lose. The return would be positive always.
  • For smallest time frame of 1 month, the percentage was around 55%, which shows that for smaller time frame the equity returns are random like coin toss which is 50%-50% possibility. But as time horizon increases its more of power of Equity, rather than randomness.

Get Free updates on your Mobile

Conclusion

Many people are afraid of Equity because it can give negative returns, which is 100% true and possible, but people do not understand that its not a short term wealth building asset class. Its some thing for long term.

When you invest in Equity for Long term, you are bound to get excellent returns given that you have faith on Statistics, Historical performance and the concept of Equity in general. You can also maximize your investment performance by active participation in your investment and honoring Asset-allocation and portfolio re balancing from time to time.

Time spend and tools used to this article

You might have spent 20-30 min to read this article, but I spend close to 25-30 hours on

  • Finding data
  • Doing calculations
  • Making Computer program in Python: See the Python Code written by me for this article
  • Making Charts in Excel, See Chandoo.org for excellent Tips
  • Actually Writing this article

Comments Please, I would like to hear your views on this article and your views on Power of Equity. Is there something to be added? And Did this article succeed in changing your views about Equity or not?

Note : I will be on vacation now and will keep posting some articles whenever I get time .=”

What is Dividend Investing and How to find Dividend Stocks?

How do we get a consistent income and good growth both at the same time from our investments? In this article, I have talked about, what is dividend Investing and what are the important things we have to consider for investing with the purpose to build consistent income from such investments.

We will see the concept of Dividend Investing and the risks involved and some examples of stock which are considered to be good Dividend Stocks.

Dividend-Investing

What is Dividend and Dividend Yield?

When a company earns the profit, it has two choices:

  1. Either invest that profit in back in the company advancements
  2. Payback profits to its shareholders so that they get some return from the investments they made

So, generally, companies declare some part of the total profit as Dividends to its shareholders. Suppose a Company earns the profit of Rs.200 crores and it wants to give 100 crores as Dividends back to shareholders and there are a total of 10 crore shares in the market.

It will come out to be a dividend of Rs 10 per share. Now, if the face value of each share is Rs.100 (10/100), then it will be called as 10% dividend declared by the company, but if the Market price of that same share is Rs.200, then the dividend yield would be just 5% (10/200).

So what matters is the Dividend Yield and not the percentage of Dividend that is declared.

Suppose, you have 200 shares of Infosys and its current market price is Rs.1000, whereas the fave value of Infosys was Rs 10 and Dividend per share is declared at Rs.50, then the dividend percentage will be 500% (50/10), but the yield would be just 5% (50/1000) and your Dividend income will come out to be just Rs 10,000, which is 5% of your shares current market value of Rs 2,00,000.

See the Video Below to understand a little more.

How to create a regular and consistent Income from Dividend Investing?

So, the basic idea here is to invest in those stocks which have an excellent history of paying Dividend. The important point is to note the dividend yield earned from these stocks. You might be interested in Stock Market Analysis using Nifty PE

The advantage of Dividend Investing:

Your Investment Growth: The stock price will have good growth over the long-term and the share prices will grow.

Consistent Income from Dividends: You can also get a good income from the dividends you receive from Stocks

Tax-Free Income: As per current income tax rules, the dividend received from Stocks are 100% tax-free, unlike Mutual funds dividend where there is Dividend Distribution Tax.

Note: So Even if your Stock grows at 7% per year over long term and has a Dividend payout of around 5% every year… your actual return from the stock would be 12% approx which is a very good return.

Example of Some good Dividend Paying Stocks

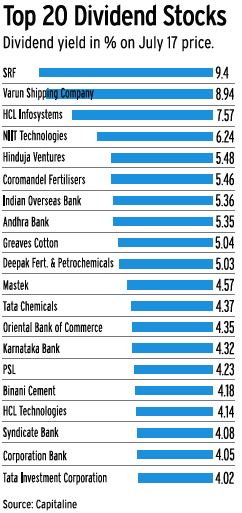
Also, see this chart with Top 20 Dividend Paying Stocks list by

Top 20 Dividend Paying Stocks

Where to find out the Dividend Information for a Stock in BSE and NSE?

Click Here For BSE

https://www.moneycontrol.com/stocks/marketstats/nsetopdiv/index.html

See this NTPC Analysis by TIP GUY, You can refer to his blog for all your Dividend Investing related queries, He is an expert on this Topic

See other articles on Dividend Investment Here

Conclusion

People who have a good amount of money to invest in the stock market and also want consistent returns per year can look for investing in good (researched) Dividend Stocks. This will give them good investment growth and regular income.