6 changes in mutual funds done by SEBI recently – Good or bad ?

Recently, SEBI has made some of the biggest changes in mutual fund regulations to revive the mutual fund industry.  Some of the measures which are made are said to be helping AMCs and distributors more than investors. We will look at 6 major changes done in the meeting and the full detailed circular will come in few days.

Mutual Funds changes by SEBI

1. Higher expense Ratio allowed

Do you know that close to 45% of mutual funds money comes just from Mumbai? Around 87% of AUM in mutual funds comes from top 15 cities in India, which means that only a minuscule 13% of the mutual funds money belongs to small cities in India. Penetration in other parts of country is very, very small and not encouraging. Now SEBI has proposed to increase the Expense ratio by 30 basis points (0.3%) if the mutual funds are able to increase their reach to smaller towns in India and increase their contribution to 30% . In short, if a mutual funds is able to get more than 30% of its AUM from other than top 15 cities in India, they can charge a 30 basis points expense ratio higher than its current expense ratio. Lower contribution means proportionately lower expense ratios.

The big effect, is that now there will be higher expense ratio for everyone. So inflow from smaller cities will affect investors from bigger cities. Investors from big cities will have to bear the burden of increased expense ratio.

2. No internal limits in Expense Ratio

A very big change which goes in favor of AMCs is the removal of internal limits on the expense ratio and for what it can be used. Earlier there was a limit on the AMC to charge up to 2.5% expense ratio (up to 100 crores AUM), but it was allowed to charge only 1.25% as Fund Management Charge and 0.5% as distribution charges. The rest was taken as their profits.  So earlier suppose a Mutual Fund charged 2.25% as the expense ratio, then they compulsorily had to allocate 1.25% as Fund Management Charge and 0.5% for distribution.

But now, that sum limit has been removed and mutual funds are allowed to allocate expenses the way they want. This means you can now see more advertisements, more commissions to the distributors and more aggressive selling. While this is a very big change which will make AMCs happy, they will still have to keep a check on the expense ratio because of competition from other AMCs.

3. Putting Exit Loads back into the scheme

You must be wondering what happened to exit loads earlier, where did it go? When a investor got out of a mutual funds , he was charged an exit load if he quit before 1 year. That money was not transferred back to mutual fund, nor was it the profit of the mutual fund. It was actually transferred to a separate fund, which was used for sales, distribution and marketing. But now, when a investors exits prematurely, the entire exit load money will be credited back to the scheme account and will not be treated as AMC profit. However an equal amount (capped at 20 basis points) can be included in expense ratio back to compensate the AMC loss due to outgoing investors, which means that overall, for the investors on one hand,  the AUM gets increased (NAV increased marginally because of exit load money coming back to them), while at the same time they’re paying more in expense ratios, so the net effect of this would be, no gain no loss to both the parties.

4. Direct Plans with lower expense ratio

SEBI has directed that for each mutual fund, there has to be a equivalent Direct Plan with a lower expense ratio. So for every mutual fund XYZ, now you will see XYZ and XYZ-Direct options. So XYZ will come with higher expense ratio, and XYZ-Direct will have lower expense ratio. Many people who research mutual funds and like to buy it on their own directly from AMC by passing agents and other online distributors, this option will be cheaper and makes sense. However, many distributors are not happy with this move and think this will “kill” their business, all because investors will then just invest into the direct options.

Note, SEBI has not yet clarified by how much lower, the expense ratio of the Direct plans will be and if it will be mandatory for each and every plan or just some categories. We’ll need to wait for the final circular, to find out.

5. Financial Advisers and Distributors separation

Very soon, financial advisor regulation will come into effect. This means, now there will be some minimum qualification, registration and guidelines for financial advisers. They will have to register with SEBI and a separate body of regulators will soon be created for this. A financial advisor is a professional who advises his clients on investments for a “fee.” The important distinction being, he wont be able to earn any money from commissions by selling financial products. If a person wants to sell financial products and earn commissions out of it, then he will not be able to “advise” the clients. But CA, MBA, and several other professionals are kept out of this rule and even mutual fund agents who have a valid ARN code are kept out of this rule because their basic advice is seen as the extention of their work. There is still more clarity required on this, so don’t conclude anything yet.

What does it mean finally ?

If you are wondering what it means overall in single sentence, then it means increased costs (expense ratio) and lower returns for investors, but it may not be that bad as you think. Dhirendra Kumar of Valueresearchonline feels that the expense ratio increase will be in range of 0.1% to 0.4% range.

All in all, investors could see a 0.1 to 0.4 per cent increase in the fee that they effectively pay to have their funds managed. Any increase ends up reducing the returns that funds generate but all in all, this has been a deftly managed round of reforms that could get a decent bang for the buck.

Lets see all the changes and what effect it had finally on different aspects


Criteria Before Now
Expense Ratio Charged Maximum 2.5% allowed (depending on the AUM) Now additional 30 basis points is allowed if the fresh inflow’s from smaller towns
Internal Limits on Expense Ratio Internal Limits of 1.25% for Fund Management Charges, 0.5% for distribution costs No internal limits now
Where did Exit Load go ? Earliar it went to a seperate fund used for marketing and sales Will be added back to Scheme AUM, but will not benefit investors because of equivalent increase in expense ratio (limited to 20 basis points)
Direct Scheme of Mutual Funds Earliar there was no distinction between a investment made by agent or directly with AMC A new category called “Direct” will be introduced which will have a lower expense ratio.
Service Tax Borne by AMC Borne by Investors
Distinction between Adviser and Distributor There was no distinction earlier The regulations are now coming in . Advisor and Distributer will be separated.


What do you think about these changes ? Which changes do you think are in favor of investors and which are against them. How will this affect your investments in mutual funds in coming months and years ? Are you happy about these changes ?

Best Mutual Funds House [Graph]

Which is the best mutual fund House ? Is HDFC better than DSP Black Rock or Reliance ? A very good way of looking at it is to see all the equity oriented mutual fund schemes of a fund house and check how many of them have outperformed its benchmarks in different time frames like 3 yr, 5 yr and 7 yrs?

For instance, Birla Sun life which has 16 equity funds with more than 5 yrs of history, but out of those 16 funds almost 8 of them have not outperformed its benchmarks, which is not very encouraging. The same kind of scenario is with SBI & UTI mutual fund houses.

On the other hand if you see HDFC , Franklin templeton, Reliance & ICICI Prudential Fund house, they have done much better, a higher percentage of their schemes has outperformed their respective benchmarks. Its a very clear indicator of a AMC overall performance . So its very important to understand which AMC’s are doing better over their whole basket of mutual funds and which are not. Below is an info graphic which I have re-aligned using a PDF document published at Livemint article here . Credit goes to Kayezad E. Adajania from Livemint who has done this research. Good show !

Best Mutual Funds AMC

100% of HDFC Funds outperformed their benchmark

You can see in the above graph that only HDFC is one fund house which has all its equity schemes outperform its benchmarks in 3 yr, 5yr and 7 yr category. Which Mutual funds are you invested in? Do you feel you should move to the fund houses which have shown better performances ?

Which mutual fund AMC is your favorite and why ? What do you have to say about this study ?

Mutual Funds Performance vs Benchmark Performance

How would you judge whether you have scored good marks in an exam? How do you define “good”? If you had a very very easy test and most of the questions were easy, would you call 80/100 a great score? NO. In the same way, if the exam was very very tough and made everyone cry, but you scored 75/100. Would you call it a great score then? Yes! So the point I want to make is there’s always a benchmark in any area to decide if the performance was good or bad. If you have done better than the benchmark, you did well, else you did bad.  This is exactly how mutual funds are to be judged. You can’t just say a mutual fund has performed bad or good based on the returns it has given in a time frame.

What is a Benchmark?

Each and every mutual fund has a mandate and rule defined on where will it invest and in what proportion. Like if a mutual fund says that it will invest in all the large-cap companies in India, then its benchmark would be mostly NIFTY because NIFTY is the indicator of the large-cap companies. And the whole point of investing in a large-cap mutual fund is that it should give you better returns then NIFTY because you can always invest in NIFTY and get the returns without any fees or risk. So only if a large-cap equity mutual fund beats NIFTY, you can say that it performed Good. Because if it does not then it has performed badly even after you paid him the fees, what’s the point of paying the fees and getting returns lesser than the Index which gives you some returns anyways.

In the same way a Small Cap Mutual Fund would have CNX MID CAP. One can just buy that Index and get returns from it based on the movement of the stocks in that benchmark. A mutual funds tries to take a call on what stocks to select and when to get rid of them to generate superior results and only if it can beat its benchmark, we can say that the mutual fund performed better than it’s benchmark.

Bad Market Performance in the last few years

So in any mutual fund, there is a benchmark and you can say that the mutual fund performed good or bad in a time frame only if the returns from a mutual fund are better than its benchmark for that particular period. Now based on this very simple rule, let’s see some cases. In the last few years, stock markets have performed badly. This bad performance from markets will obviously affect mutual funds performance too. So if a mutual fund has not given double-digit returns, can we conclude that mutual funds are bad investments? No.

Sandeep asked a question related to this 

I was told that HDFC Top 200 is an excellent fund . But I invested around 50,000 in that fund last year and now my fund value is near 46,000 . Is this fund really good ?

This kind of questions come to all the investor’s mind, this happens when you dont know how exactly you should judge a mutual fund’s performance. The only way here to say is HDFC Top 200 did good or bad in the last 1 yrs is to see if its return is more than its benchmark or less than its benchmark and to what extent?

HDFC Top 200 example 

If you look at HDFC Top 200 returns in the last 1 yrs from today (27th Apr 2012), its return has been -9.8 %. Now anyone hearing that kind of return will scream – “Oh .. that’s really bad”. But when you look at its benchmark (which is BSE 200), you can see that its benchmark has given around -12.06% So you can clearly see that HDFC Top 200 has outperformed its benchmark by 2.26% which means that it has done a better job.

Note that mutual funds have stocks as the underlying assets in which they invest, so mutual funds performance will depend totally on stock markets performance and in last 5 yrs, its not mutual funds which have performed badly, its actually stock markets, Mutual funds just mimick the portfolio’s in some manner and the real parameter of how good or bad they have done is to see how they have performed compared to the risk-free benchmark they are following.

Now coming back to the same example of HDFC Top 200 , it has given around 22.6% returns CAGR in last 3 yrs , but its benchmark (BSE 200) return was just 16.2% , hence you can say that HDFC Top 200 has done a good job and outperformed its benchmark by 6.2% on yearly basis, that’s really a good number.

Escorts Tax Plan Example 

Now lets look at 5 yrs performance of a tax-saving fund called Escorts Tax Plan, The fund has to give -15% return on absolute level in last 5 yrs (1 lac became 85,000) and an agent can say – “Sir – markets were doing badly in the same time, that’s the reason the fund has given bad return’s, in future it would do great” . In this case, all you need to ask is – “Fine, I can understand that market performance affects fund performance but has it performed better than the risk-free benchmark it was following? “

If you look at its benchmark “Nifty”, it has given a 24% positive return in the same period. This means that the fund has performed worse than the index which is totally free, while the fund has not performed even after bring run by professional fund managers. Then what’s the use of that fund.

So now you have a simple rule to judge a mutual fund performance

  • If Fund Performance > Benchmark  – The fund performance was good
  • If Fund Performance < Benchmark  – The fund performance was bad

Note that the duration should be good enough like more than 1 yr at least to say anything and the gap between the fund performance and benchmark performance should also be considered. You can say that a fund was bad just because its returns were 8% and the benchmark was 7.8%. that is very much close and does not conclude much.

Now a fairly good way of choosing a mutual fund is just based on how it has performed in the last many years compared to its benchmark. So I am putting up some top funds which have done very good compared to its benchmark

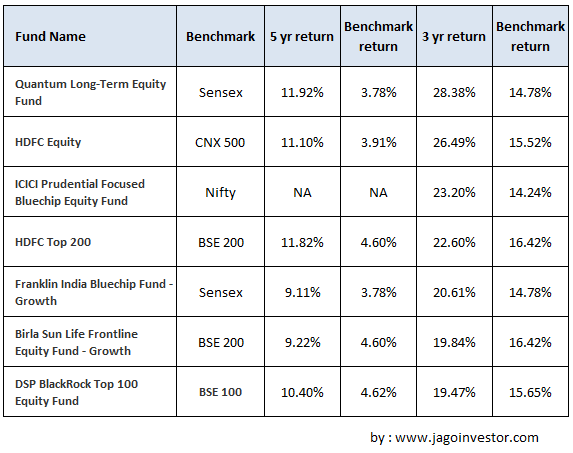
Some Top Mutual Funds vs Benchmark Returns

The following are some of the very good potential mutual funds for 2012 and they are really doing good overall. Let’s see their returns overall for 5 yr and 3 yr timeframe along with their benchmark returns. You can see some funds outperformed their benchmarks with huge margins. For example, Quantum Long term equity fund has return 28.38% in 3 yrs compared to just 14.78% from its benchmark which is Sensex. Thats 100% more, really brilliant.

Mutual Funds performance vs Benchmark performance

So overall the learning is that if you want to find out some good performing mutual funds, you should be looking if a mutual fund has outperformed its benchmark over several years with a good enough margin or not. If it has consistently done that, you can be clear that fund management is going well.

How often do you look into the benchmark? What else do you think should be looked at while judging mutual funds?

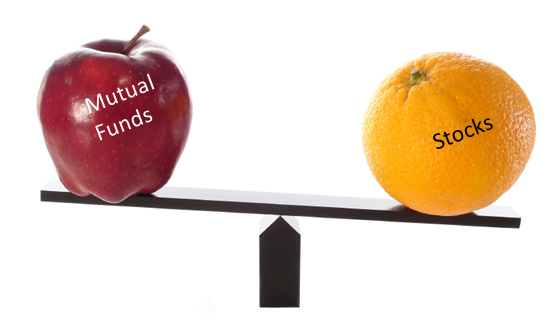
5 difference between stock & mutual funds Investing

When we say Equity, what comes to your mind – Stock or Equity Mutual Fund? While a single stock or a mutual fund both comes under the category of Equity and they are good option for long-term investment and needs periodic review. There are some differences between stock investing and mutual fund investing that is done by a common man. It’s a good idea to know where they differ and in which situation they differ, so that one can take better investing decisions. Let’s look at the main differences


Stocks and Mutual Funds Difference

Volatility

When you invest in a single stock or bunch of stocks (3-5 scrips), the change in it’s value is very high. On a given day it can be extremely volatile. It can give you 20% return and sometimes -10% loss also depending on the environment. This can be very exciting and at the same time very disheartening and gives you a feeling that you need to “act fast”. 

Mutual fund on the other hand is not that much volatile by nature, as the diversification is very large and at a time 50-100 stocks are covered. Different kinds of stocks from different sectors and market capitalization are involved in mutual fund and the over all change in value is thus less volatile (other than extreme days).

Return Potential

This is very much in line with the above point but still let’s look at it separately. There are lot of success stories where someone got quick rich by investing in equities directly and it can happen, but those are rare happenings and require lot of work and analysis, patience and belief in what you have picked. If you want superb returns in short time and you believe you can research well, you can go for stock investing directly but then risk is also more.

Mutual funds are known to deliver good returns (not in line with stocks, but still very good). So you can expect handsome returns from mutual funds but not unbelievable like stocks return. This is mainly because the money is diversified across different stocks (read ideas) and chances of all of them becoming a super success in short time is impossible.

Monitoring Required

Stock investing is a personal affair and you are doing it on your own the decision of what to sell and what to buy is on you. Even in case of long-term investing, you might have to keep an eye every quarter or yearly unless you have really spent some good time in picking the good stock. You need to also keep an eye on news and sector specific developments.

Monitoring in mutual funds is relatively low because the job of monitoring is anyways done by the fund manager who is paid SALARY to filter through the fluctuations. He constantly adds and removes the stocks from the portfolio. This can be a positive point, but sometimes it can be a negative point also if there is too much of churning.

SIP Investment

Mutual funds are known for possibility of SIP (monthly investment). SIP in mutual fund works and is recommended as a great way for a salaried person to invest in equity markets for long-term basis without understanding the working of equity markets.

However SIP in stocks do not work. Yes, some companies provide you the facility of SIP in stocks, but it’s a terrible concept. There is no diversification and SIP in a particular stock does not make sense because the risk is with single stock. A stock can be in a bad phase for years and decades, whereas in a mutual fund the bad performing stock is weeded out.

Asset Class Restriction

Stocks investing is restricted to Stocks only. You can choose a large cap stock, mid cap stock or small cap stock, but finally it will be equity asset class. However, mutual funds can invest in mix of asset classes. There are equity funds, debt funds, gold funds, Mix of Equity and debt also. To top up, even balanced funds are there which can adjust the asset allocation on its own, so in a way mutual funds are more superior in terms of features compared to a single or bunch or stocks.

Conclusion

Mutual Funds are actually collection of stocks only but just because it’s a group of stocks the characteristics are not very similar to that of stocks. You should be clear about all the points of difference and only after that you should decide whether to invest in Stocks directly or take the Mutual Fund route.

Review of Tata Retirement Saving Funds

There is a new retirement plan in India designed through a mutual fund that is launched by Tata mutual funds called the ‘Tata retirement saving plan’. The company is trying to market it using a word 30-30 challenge which says that there are 30 yrs of our work life and then 30 yrs of retirement life and you need to plan for the next 30 yrs in the first 30 yrs. The plan is currently at NFO stage and will be open till 21st Oct 2011.

Tata retirement savings plan

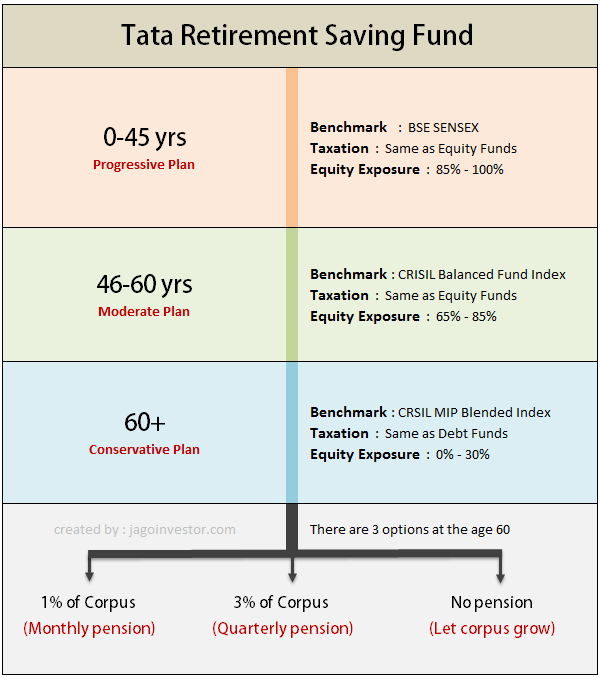
There have been some readers who enquired about this plan in our forum. Let me review the plan in this crisp article. Basically this plan has 3 different kinds of funds inbuilt which are called as 1) Progressive Plan, 2) Moderate Plan and 3) Conservative plan which all have different risk profiles (risky, balanced and safe). As per the asset allocation rules the investor’s money will be moved from one fund to another fund as per his age. So all investors who are below 45 yrs age will be in progressive fund (highest risk), then once they reach 45 yrs, their money will be moved to moderate plan and once they reach 60 yrs, they will be moved to the safest option called conservative plan. Once investor reaches 60 yrs of age, he will be getting pension from this plan in form of SWP (systematic withdrawal plan) which is nothing but a known way of withdrawing out of mutual funds systematically. There will be option of getting 1% of corpus monthly or 3% of corpus quarterly. Let’s see this auto switch and auto withdrawal options in a little detail.

Auto-Switch

There is an auto-switch facility in this plan, which means at each milestone you will be automatically be switched to the next fund without any exit load. So when a person reaches age of 45, he will be switched from Progressive plan to Moderate plan automatically and when he reaches age 60, he will be auto-switched from moderate plan to conservative plan. Note that one has to choose for auto-switch option at the time of buying the plan.

Switch between the funds manually

One can also switch between the funds manually whenever they want, but in that case if the switch is before 5 yrs from the date of enrolment, there will be exit loads applicable, but if 5 yrs has passed, then 3 exit load free switches will be allowed.

Auto systematic withdrawal plan (Pension)

A feature called Auto systematic withdrawal plan is there in this plan, which will start redeeming your funds and start giving you your money in the form of pension. There are two options in this. In the first option you can get 1% of your total corpus each month and in second option you can get 3% of your corpus each quarter, as decided by you. You will also have an option of not taking any pension amount through SWP route if you wish. So one can just leave his money in the fund and let it grow.

Tata retirement savings plan

High Exit Loads

As this is a long-term investments tool, the early withdrawals are discouraged and the exit loads are high. There is no exit load if you withdraw your money after 5 yrs of investment, but if you withdraw your money before 5 yrs there are high exit loads. The exit load comes down by 1% each year till 5th year. So in first year, the exit load is 5%, in second year its 4%, in 3rd year its 3% and so on… At last after 5 yrs, there is no exit load.

Some other points

  • Minimum Investments for Lumpsum = Rs 5,000
  • Minimum Investments for SIP = Rs 500
  • There is only growth options under this fund , no dividend options
  • As per the plan mandate, fund manager can also take upto 10% positions in derivative products ,which can be quite risky.

Good points

  • These kind of plans are much better than regular pension plans as there is a good enough equity component which is good for long term.
  • The good thing about this plan as a retirement plan is that you get a known amount (in percentage terms) from your money, unlike the NPS

Not so good points

  • As this is a NFO , one can not be sure of its performance, features are ok, but the real thing would be the performance of the fund.
  • The exit loads are high in starting years, which makes exit not so attractive incase the fund performance is bad and one wants to get out of it.
  • The fund has features which will come into effect after many – many years. For a 25 yrs old, we are talking about 20-30 yrs from now when the auto switching will start happening. It’s quite early to comment on how it will turn out then, because there is not much history at the moment about the performance of mutual funds with such long durations.

For Jagoinvestor readers who are quite pro in themselves, the personal suggestion would be to make their own diversified portfolio and have a full control on what they can do with it. This fund look good from features point of view, but it’s mainly for non-DIY kind of investors.

Full Brochure : Small Brochure

How to redeem mutual funds units – Procedure and Forms to fill ?

Most of the people investing in mutual funds through agent offline have this question – “How to redeem mutual funds ?”.  mutual funds investors often do not know what the procedure to redeem these mutual funds. I redeemed some of my ELSS mutual funds (HDFC tax saver , Sundaram Taxsaver, HDFC long term advantage Fund and SBI magnum taxgain fund) which I had bought some years back from an agent, so I thought why not let everyone know what is the simple procedure for redeeming the mutual funds.

Mutual funds redemption Process

Process to redeem Mutual Funds

if you have bought the mutual funds from an agent or from the AMC directly, then you will have to fill up the mutual fund redemption form. This form is available from the mutual funds AMC office (you can get its office address from internet). You will have to go to their office in person. You can also go to the nearest CAMS office and fill up the mutual fund redemption form directly from there.  It’s much convenient to visit CAMS office and directly redeem more than one mutual funds in one go (this is what I did in my case).

The redemption form is very easy to fill and all you need to put is your name, folio number (make sure you put correct folio number, else it will create issue later) and the number of units (exact number or ALL) you want to redeem. Just give this form to the CAMS processing assistant and they will put up your request.

Important Points

1. NAV Applicable: If you give your redemption request before 3:00 pm, the same day closing NAV will be applicable, else you will get next day NAV. So make sure you do the redemption well before 3:00 pm if you want same day NAV.

2. Bank accounts: Where will you get the money when you redeem the mutual funds? You will get the proceeds in your same account which is registered with your AMC (which you used to pay at the time of buying). If that account is not active, then there are few run around like you will have to attach the cancelled cheque of your new bank account or copy of pass-book etc and if you don’t have that, then a declaration from the bank and sign of some bank manager etc. So this can be a little frustrating if you are in urgent need of money. In my case my old account was active so it was pretty easy for me.

3. CAMS do not handle all the AMC’s redemption: CAMS do not handle each and every Mutual funds transaction. It can happen that you will have to go to the AMC office itself for redemption. Like in my case I had to go to Sundaram AMC office to redeem my Sundaram Tax Saver proceeds. So check with CAMS which all mutual funds they handle, you can shoot an email to your city CAMS (their emails and addresses are there on CAMS website

4. How much time it takes to get money? : It generally takes 3-4 working days to get the money credited in your account. But in my case I got it in next 2 days itself. So if you redeem the funds on Monday or Tuesday, you can safely assume that you will get the money by the weekend. But if you have weekend falling in between, then it can take some time.

Process of redemption if have bought Mutual funds online

If you bought your mutual funds from your demat account or some online brokers or if you activated your online account after buying from agent, then you can redeem your mutual funds online itself just by following the procedure mentioned by your online account. Most of the people who buy tax saving mutual funds (ELSS funds) online can also redeem tax saver mutual funds online only.

Did you activate your online account with the AMC ?

If not, I would suggest you to do it, so that you can take the redemption action as and when required. What was your redemption of mutual funds experience? What point’s people should keep in mind while redeeming? I hope you are now clear on how to redeem mutual funds ?

Why to increase sip amount in your Mutual funds

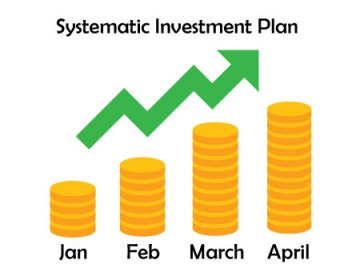
Do you want to increase the SIP amount for your mutual funds ? Or you want to keep it constant always ? A lot of people start with a SIP amount at first and then look forward to increase SIP amount later. This is a very common of every investor and its “how to increase sip amount”

Increase SIP amount

When we say “SIP”, it generally means constant SIP, which does not increase every year. When we calculate SIP amount using any SIP Calculator – the SIP value is generally very high and does not look realistic and at times and such high investment can trigger affordability issue. However there is a clear solution for this, which is used by financial planners and that’s called “Increasing SIP”, where one starts the SIP with a lower amount and then gradually increases them year on year. This looks more realistic as one’s income also increase overtime and ability to invest increases. We see this situation a lot while working with our clients under financial coaching program.

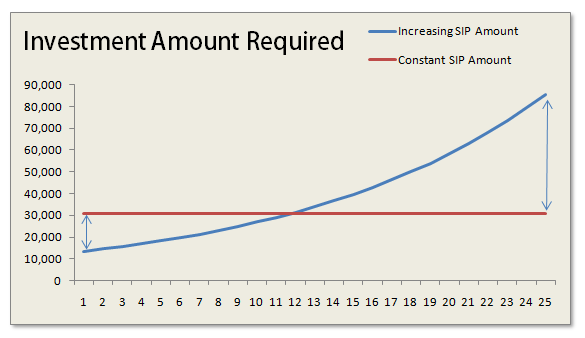
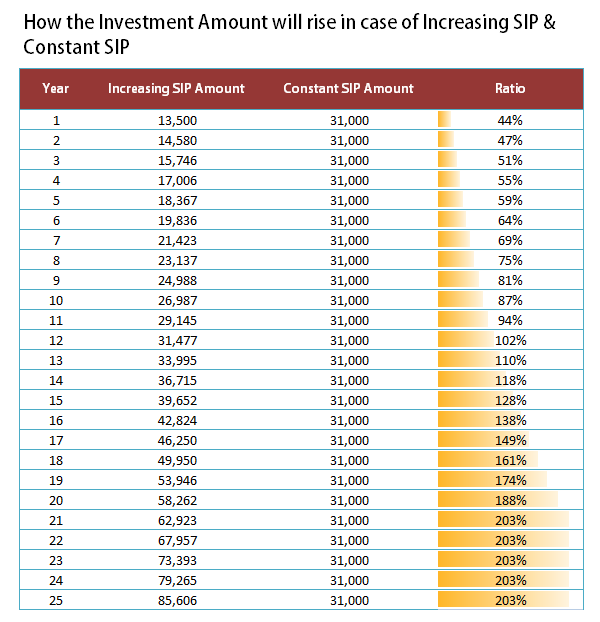
Let me show you the example : Ajay wanted to accumulate 5,00,00,000 (5 crores) for his retirement which is 25 yrs away. When he calculates the SIP amount, it’s coming around Rs 31,000 (assuming 12% returns from equity). Now it’s not possible for Ajay to invest Rs 31,000 every month, as it’s a very high amount. Rather he is fine if he can start with a small amount today and then increase it every year as his income would also increase with time. This is called as Increasing SIP model. If Ajay is ready to increase his SIPs by 10% every year, then he has to start with just Rs. 13,500. This amount is much more convenient for Ajay to arrange, rather than Rs 31,000 per month.

Should you increase SIP amount or not ?

At the first look, a general conclusion which comes into mind is that Increasing SIP is better than Constant SIP because it is much convenient and looks logical that investment should rise as the income increases. But there are different angles through which both the options can be looked at. Let’s look at two important points one by one.

1. Investment required in case of Increasing and Constant SIP

One of the most important factor one can judge both the situation is the amount of investment needed. If we take the above example we just discussed, one would need to start SIP of 31,000 per month to accumulate 5,00,00,000 in 25 yrs assuming 12% return. Now this amount will be constant throughout the all 25 yrs. Where as one can choose to start his SIP with Rs 13,500 and then increase it by 8% per year, but in this increasing SIP model, his SIP amount would reach 50,000 in 18th year and 85,000 in 25th year, which might look very big in numbers, but years from now, it would be worth a small amount considering the purchasing power of money and the annual income one earns. So don’t get surprised by numbers.
SIP amount increase
One should opt for increasing SIP, when his situation really does not allow him to invest a big amount and he is very sure that he would be able to increase his investments in tune with his salary increase. Truly speaking I am in favour of Constant SIP if one’s situation permits because that way you are investing more in the start of your life and that would help you keep your SIP in check later on in life. Imagine after many years in life, you have to just invest the same amount where as your Income has risen 3X. Isn’t it a big relief and freedom to do whatever you want from your money at that time. Imagine your salary is Rs 50,000 per month and you do SIP of 10,000 and even after 10 yrs, when your salary has risen to say 1.5 lacs per month and you are still doing SIP of Rs 10,000 only. I would choose to pay a little more today and then get into that kind of situation.

Most of the people who are not able to go for constant SIP, because of high SIP amount is because they are very late in investments and now their goals are near and they have less time for compounding. These people have high expenses already in life. Had they started long back when they started earning they could be in a better situation now. Below is the table which shows the Increasing and Constant SIP amounts required for the example discussed above and shows you the ratio of increasing and constant sip. You can see how it started with 44%, but rose to 203% later after 25 yrs.
Increase SIP amount

Conclusion

One should start his SIP’s early so that he can keep his SIP’s constant through-out the tenure. If you are late, then your SIP amount will be very high and will look unrealistic and then you will have to increase your Systematic Investment plan (SIP) amount in future if you want to reach the goals.

2. How the corpus will grow in case of Increasing and Constant SIP

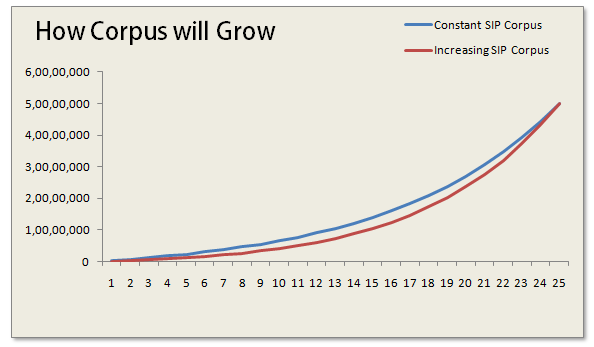
The other major thing to look is how your over all corpus would grow in both the cases. Note that in constant SIP and increasing SIP, the final corpus is getting accumulated and they reach the same point at end, but in case of Constant SIP, the overall Corpus is always higher than the increasing SIP and it’s because you are investing higher amount in the start and that way the compounding factor is in your favour. See the chart below which shows, how the gap between the two narrows down at the end of the tenure and both the cases lead to same corpus.

Systematic investment plan money increase

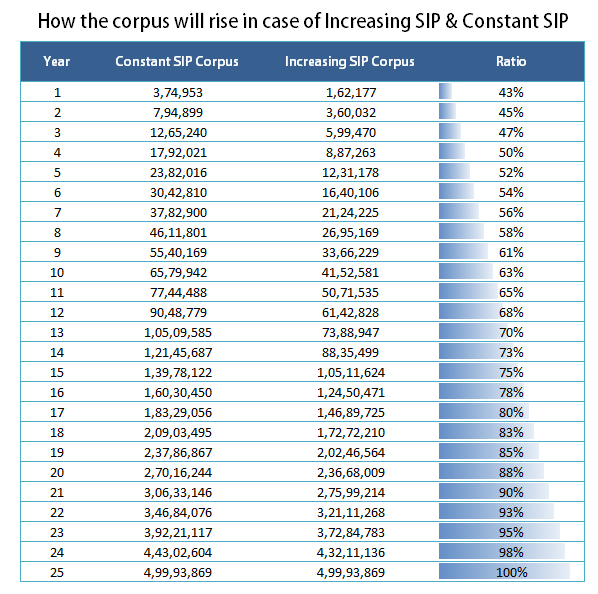
If you look at the table below, you will see that the maximum difference between the two is 36,00,000 in 17-18th year and after that the difference starts coming down (not so clear in table , you need to calculate it) . As you are starting with lower amounts in increasing SIP, the overall corpus is obviously going to be less, but it’s very much above 50% all the time, so if you are saving for long-term, you should be interested in the final corpus.

SIP corpus growth

Note that the example and charts above are assuming a 25 yr old tenure and equity returns of 12%. The numbers would change depending on tenure and the equity return, but the overall conclusions discussed above remains same. For a shorter tenure like 4-5 yrs, the constant SIP and increasing SIP won’t differ a lot; it would be a small number.

So the conclusion is that one should keep on increasing their mutual funds SIP amount as and when they can , preferably every year. So are you ready to increase sip amount ?

What is Expense ratio in Mutual Funds

Do you know how expense ratio can impact the returns on your mutual funds returns ? We often hear that expense ratio of a fund is 2% or 1.8%, but we never put lot of thought to understand its impact on our mutual funds returns and our own wealth! Lets touch this topic today in detail. For simplicity, I will talk about Mutual funds in this article, but expense ratio as a concept is applicable in almost all the management financial products like Mutual funds, UlIP’s , NPS etc

Expense Ratio Mutual Funds

What is expense ratio in Mutual Funds?

Let me first clear out what is expense ratio? As an investor we just buy and sell mutual funds, but in the background there are many expenses which a mutual fund (and even ULIP’s) has to incur. Some of which are; fund management fees, agent commissions, registrar fees, and selling and promoting expenses. As per SEBI regulations, the maximum expense ratio of an equity fund can be 2.5% and for a debt fund, it should not cross 2.25%.

Now who will pay for this? Obviously you have to pay for it and that’s where expense ratio comes into picture. Expense ratio is cut from your investments on daily basis from mutual funds and only after that NAV is published and that’s how you pay expense ratio. For Example, If you have invested Rs 1,00,000 in a mutual fund whose expense ratio is at 2% and suppose your mutual fund saw a growth of 0.5% in a day, which turns out to be Rs 500. You NAV won’t be 1,00,500. Before that you will have to pay 2%/365 (that’s 365th part of 2% as charges, as it’s for 1 day, remember 365 days in a year) and that would be, Rs 5.48. Hence, final value of your investment would be 1,00,000 + 500 – 5.48 = 1,00,494.50 that’s 0.4945% increase and not 0.5% .

So, the next question which will come in your mind is “So, does this small deduction really make a lot of difference?” The answer is Yes & No. If you are looking at 6 months or 1-2 yrs, it’s not much of a concern, you can probably just avoid it and answer is Yes, if you are looking from long-term point of view like 5-10-20 yrs. In that case it’s mostly something which you can put your eye on once.

Expense Ratio – With & Without

Let me first give you a very clear idea about the distinction between two scenarios where there was expense ratio and there was no expense ratio in a mutual fund. Let’s take this example at least to understand the concept.

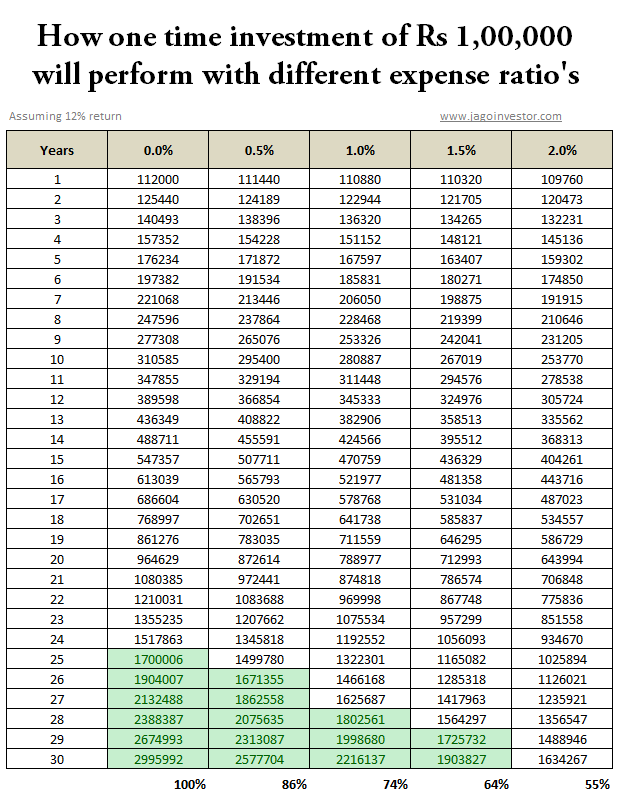
Suppose there was a mutual fund called “Jagoinvestor-Ninja Fund” (attractive name haan!) which generates a 12% return before expense ratio. Now let’s see how this fund final returns will turn out to be in different expense ratio scenarios like 2% , 1.5% , 1% ,0.5% and 0% (imaginary) . Expense Ratio Mutual Funds

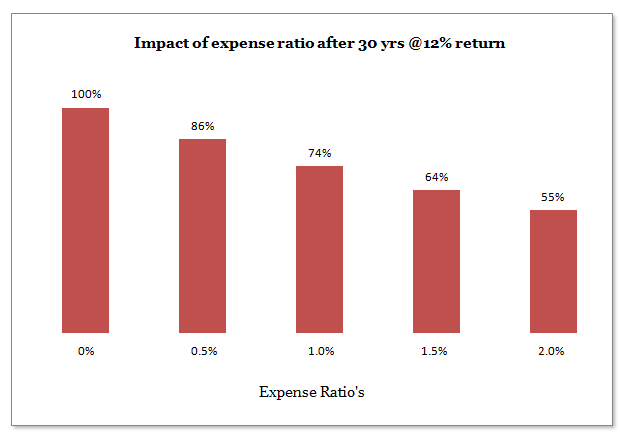
Did you see that? How same funds performance can lead to huge a huge difference depending on expense ratio. In a longer term, you can see how the corpus value reached 29.9 lacs without any expense ratio, but if the expense ratio was 2%, then despite the same performance, the corpus would be reduced to only 16.3 lacs. That’s huge deficit of 45% compared to original corpus. While it’s a little unrealistic to consider 0% expense ratio, because it’s not possible in real life. Let’s see the different between 1% and 2% expense ratio. You can see that with 1% expense ratio the corpus was 22 lacs and with 2%, it was 16 lacs, that’s again huge 20% difference.

Also if you see the chart above, you can see a greed part showcasing how low expense ratio cases achieved the same corpus few years early than the high expense ratio scenario. You can see that with 0.5% expense ratio, 16 lacs was the corpus in 26th year itself which took 30 yrs in case of 2% expense ratio. In the chart below you can see how much the difference in different scenario’s final corpus percentage wise was.

Expense Ratio Mutual Funds

Remember that when you compare returns of mutual funds in long run (video), the calculations are shown after-expenses; hence it might happen that a better fund today is better in returns because its expense ratio was lower than the other one. It might happen that two funds differ in returns to some extent, but don’t vary too much when it comes to their ability to generate returns before the expenses. Naturally the mutual funds which have lower expenses would have better return at the end.

Case Study – HDFC Tax Saver vs Canara Robeco Equity Tax Saver

If you look at Valueresearch website, it has given Canara Robeco Equity Taxsaver fund a 5 star rating, but HDFC Tax saver gets just a 4 star. If you look at both these funds history, both the funds are 15 yrs old funds and if you look at short-term performance of both the funds, you will see how Canara Robeco is doing equally good or better than HDFC Tax Saver. But if you look at long-term performance of both the funds, you will notice a big difference.

While HDFC Taxsaver stands with tall chest giving 31% annual return, Canara Robeco seems to stare the earth with just 20% annual return. Now there can be a lot of reasons for this, but if you look at expense ratio, Canara Robeco has as high as 2.49% expense ratio, where as HDFC tax saver has just 1.91% expense ratio. So it might happen that Canara Robeco these days has to perform better than HDFC Tax saver before expense ratio and only then it’s able to sustain the performance.

As per a small study by moneylife, this phenomenon is true across the category , here are the excerpts : –

Consider the performance of 43 equity diversified funds which have been in existence before 2000. We chose 2000 because we wanted to gauge decadal performance of the funds. Of these 43, we selected the 15 most expensive funds and 15 cheapest. Among the expensive lot, we have only seven outperformers and eight underperformers. Whilst among the cheap funds, we have 12 outperformers and only three underperformers. It is not that the expensive funds have not earned good returns, but a part of their returns has been washed away by their high expense ratio.

For instance, Birla Sun Life Advantage Fund, which is one of the costliest and was launched in February 1995, has given a return of 19% beating its benchmark, BSE Sensex, by a margin of 8%. Reliance Growth, launched in October 1995 (seven months later), has given a return of 28% beating its benchmark, BSE 100, by a huge 16%. Was it the pure stock-picking skill of Reliance? Maybe. But the fact is the Birla Fund has an expense ratio of 2.31% and Reliance Growth Fund has an expense ratio of just 1.79%.

Conclusion

High expense ratio will hurt you in long run, so incase you are choosing two similar looking and similar performing financial products, you should look at their cost structure.

Can you share what you took from this article and how you will apply in your financial life?

Balanced Funds Performance – HDFC Prudence vs HDFC Top 200

Have there been times when you thought of investing in Balanced funds like HDFC Prudence, but did not invest because you wanted to invest in pure equity funds with maximum exposure to equity? If yes, than you need to rethink this thought because balanced funds have performed superior than equity funds in some cases and given their diluted exposure to equity as compared to that of a pure equity fund, the returns are really worth considering. So here you go-

What are Balanced Funds ?

Balanced funds are Equity Mutual funds, which are not as aggressive and as pure equity diversified mutual funds and keep equity component in the range of 60%-75% and rest in Debt products or Cash. By definition you can see that Balanced funds are not exposed to equity in the same way as regular equity diversified funds whose equity exposure is generally 95% or more in an average scenario. Balanced funds keep a balance between equity and debt, with equity still being the higher component.

For example, HDFC Prudence keeps its equity allocation around 75% in most of the cases and rest 25% in debt or cash. However, Reliance Regular Savings Balanced is generally low on equity and keeps it around 60-65%, but from last some months, it has raised its equity exposure to 70%, but hasn’t touched its limit of 75% ever! . From tax point of view, any mutual fund which has equity component more than 65% is considered as “Equity Fund” and long term capital gains are exempted from tax after one year just like an pure equity equity fund .

Balanced funds Returns less risky than Pure equity mutual funds

As balanced funds are lower on equity exposure, the fall in case of market crash is lower than pure diversified funds. For example, during the financial crisis of 2008, balanced funds lost only 42% as compared with 53% drop in returns by diversified equity funds.

Lets also see another example of Reliance Regular Saving Balanced fund, its NAV was around 17.27 on 1st Jan 2008, exactly after 1 yr on 1st Jan 2009, its NAV fell to 11.26 which is 34.78% drop, where one of the best diversified equity fund from Reliance AMC called Reliance Regular Saving NAV was 30.28 on 1st Jan 2008 and it dropped to 14.05, which is 53.6% drop. After that in next 2 yrs, Reliance Regular Balanced fund has given a return of 110% , where as Reliance Regular Saving Equity gave a 137% return, which shows that Pure equity fund gave much better return than balanced funds in 2 yrs time frame (Jan 2009- Jan 2011). But the most interesting thing is to look at the 3 yrs return starting from Jan 2008 to Jan 2011, which shows that the return of Reliance Regular Balanced fund was 137% where as the return of Reliance Regular Saving Equity was 110%, which shows that if you also consider the crash of 2008 into the overall scenario, Balanced fund out performed Pure equity fund by a considerable margin.

Comparision of Returns from Reliance Regular Saving Balanced and Reliance regular Saving Equity Funds

Balanced vs Equity funds Comparision

Main Advantage of  Balanced Funds

Balanced funds have to maintain their ratios of splitting between equity and debt by fixed percentage. In order to do so, the fund has to keep on buying and selling from time to time which leads to the concept of Asset Allocation. So, if a balanced fund has a ratio of 70:30 (Equity: Debt) and suppose it reached to 77:23, the fund manage will make sure that he sells the excess part of equity to rebalance the fund back to 70:30. However in equity funds, if the ratio itself was 98:2 earlier, despite the big run in markets, the equity part will still remain around the same ratio and there is no question of asset allocation.

So the conclusion is that the asset allocation is the internal advantage available to Balanced funds which leads to superior returns over longer term, but in short term, balanced funds will not out perform pure equity based funds incase there was a bull run. You always have to give balanced funds a long time to see the performance.

Performance of Balanced Funds vs Equity Funds

Can you imagine HDFC Prudence out-performing HDFC Top 200 despite having a low equity exposure compared to HDFC Top 200? Yes, it has happened! Now let me show you some statistics which I found out.

SIP investment in HDFC Top 200 vs HDFC Prudence

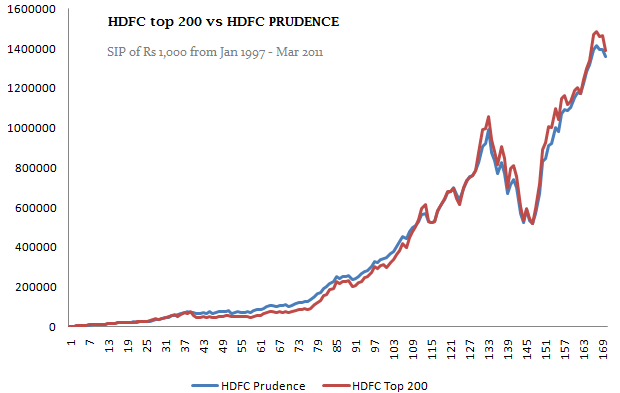
Over the last 14 yrs from Jan 1997 to Mar 2011, if you had done a SIP investment of Rs. 1,000 per month in HDFC Prudence, it would have become Rs 13.6 lacs and return turns out to be 25.93% CAGR. However if you had invested the same 1,000 per month in HDFC top 200, it would have become 13.9 lacs and return turns out to be 26.20% CAGR, marginally more … Which shows that despite having much lower equity exposure, HDFC Prudence has given almost equal returns like HDFC Top 200, which in my opinion can be called out-performance. Here is the chart of how the corpus was moving in both HDFC Prudence and HDFC top 200 for 14 yrs (SIP of Rs 1,000/month).

HDFC top 200 vs HDFC Prudence comparision

Lumpsum Investments in HDFC Top 200 vs HDFC Prudence

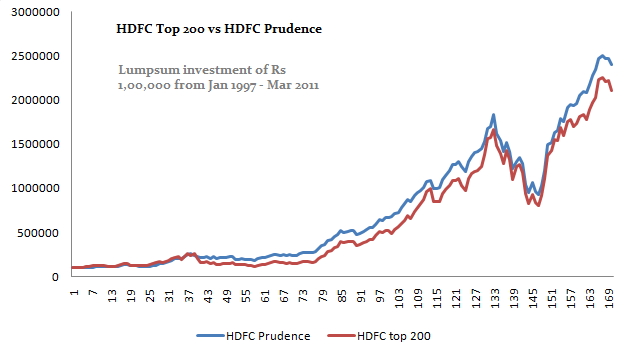
Now let’s come to lumpsum investment. Imagine you invested Rs 1 lac in HDFC Prudence on 1st Jan 1997 and I invest the same money in HDFC Top 200 on same date. We both redeem our investments on 11th Mar 2011. Who will have more money? Answer is it would be You, You will have around Rs 24 lacs (CAGR return = 24.94%), whereas I will have approx 21 lacs (CAGR return = 23.78%). See the chart below to look at how the corpus moved per month in case of one time lumpsum investment.

HDFC top 200 vs HDFC Prudence comparision

Some more statistics on Balanced Funds

  1. In the last 10 yrs , the return from HDFC Prudence is 29.38% . Only 2 Equity Diversified funds has outperformed HDFC Prudance in true sense, which are Reliance vision and HDFC Top 200
  2. HDFC Prudence 5 yrs returns is 17.93% cagr and its more than pure equity funds (The best return is from HDFC top 200 at 17.90%)
  3. HDFC Prudence returns have outperformed all the equity diversified equity funds in 3 yrs time frame, HDFC Prudence returns for 3 years is 18.65% and the best equity diversified funds in 3 yrs time frame was Mirae Asset India Opportunities Regular with returns of 17.88%
  4. The average of top 5 balanced funds return in last 5 yrs was 15.88% (17.93 , 16.97 , 15.54 , 14.55 , 14.40) and average of top 5 equity diversified funds was 16.63% (17.9 , 17.63 , 16.88 , 15.72 , 15)
  5. The average of top 10 equity diversified funds in last 10 yrs was 27.67% , balanced funds was 22.57%

List of good Balanced Mutual Funds

List of Balanced mutual Funds

Source of Data : All the data is taken from Valueresearch , and for growth category of mutual funds , not dividend , All data as on 19/04/2011 .

Do you invest in balanced funds ? What you think it would be wise to invest in balanced funds compared to pure equity funds ? Share your thoughts on this HDFC Prudence vs HDFC Top 200 comparision which must have shown you difference between equity funds and balanced funds

Monthly Income Plan : A detailed guide on MIP’s

Monthly Income Plans– When you hear it for the first time, you get a feeling that it’s some kind of assured and non-risky product that will deliver you uninterrupted monthly income, but it’s not exactly that way. Do you have a lot of cash which you want to park somewhere with the expectation of better returns than a Fixed Deposit? Are you looking for some kind of instrument that will give you regular income with decent returns with moderate or low risk?  If yes, welcome to the world of Monthly Income Plans, which are also known as MIP’s.

Monthly Income Plans

What are Monthly Income Plans?

An MIP is nothing, but a debt-oriented mutual fund that gives you income,  in the form of dividends – simple as that. As MIPs are debt oriented mutual funds, they invest heavily in debt instruments like debentures, corporate bonds, government securities, etc. It generally has 75-80% of its money in debt and rests in equity and cash. The income you can get from MIP is not limited to the monthly option. You can also choose to receive income quarterly, half-yearly or annually. Just like any other mutual fund, the MIP too comes with two options.

1. MIP with Dividend option: MIP’s with dividend option provides you an income in the form of dividends. There is an option to receive this income monthly, quarterly, half-yearly and yearly. So you have to choose the option at the time of buying the MIP. Note that while the dividend from MIPs is tax-free in the hands of investors, the company has to pay a dividend distribution tax of around 14% on the dividend before it reaches your hand. So your returns reduce by that much.

For example, If a company declares a dividend of Rs 3 per unit, they have to pay 42 paise (14%) as a Dividend Distribution Tax and you will only get the remaining amount in your hand , on which you don’t have to pay any tax. I hope you know, that the NAV of your MIP will come down by Rs 3 after the dividend is declared and given to you. So don’t shout your excitement to all the world when you get dividends, it’s just your own money which you got!

2. MIP with Growth Option: Here, the money is not paid out to you in forms of dividends, instead it keeps growing in the mutual funds. Hence your money is just growing inside the fund itself and you can reap all the benefits at the time of redeeming the funds in the future. In this option, you have nothing to do with dividends. Note that you get the power of compounding in growth options because your returns also earn in the future. Here is an article on the difference between dividend vs growth option in mutual funds to give you a better idea of what I am talking about.

Features of Monthly Income Plans

1. Dividends can be declared only from the profits and not from Capital

Regulations demand that dividends can be paid only from surpluses and not from capital investment. What it actually means is that dividends can be declared from earned income only. If your initial NAV was Rs 10 and after a month the NAV rose to Rs 10.2, The dividend can only be given out of this 0.2 and not from the initial capital value. This makes sure that Company can not show to the world that they are constantly giving income in case they have not done well.

2. No guarantee of Regular Income

The biggest myth about Monthly income plans is that they provide guaranteed monthly income, which is not true (See this question asked by Krishna on our Forum).  While the aim of MIPs is to regularly declare dividends, it might happen at times, that they do not declare any dividends because of bad performance. To top that, there is no regulation or oversight on the MIP’s part to declare regular dividends. So take it on the chin, if you don’t get your income once in a while.

3. MIP’s return is influenced by interest rates and stock market

Just because it’s a debt oriented product, It does not mean that they are “safe” . Even MIPs can give a negative return, but in extreme cases.  The debt portion is influenced by interest rates. When the interest rate falls, the NAV rises as the price of bond increases. When the interest rate rises, NAV falls. At such times the equity portion of the fund helps to maintain the return. Here is an article on Interest Rates and how they affect Mutual funds.

4. MIPs are prone to mis-selling because of a high commission structure

MIPs offer lucrative commissions to agents as much as 1-1.5%  unlike 0.5-.75% in Equity funds. Due to this, it becomes easy to missell MIP’s as they can be labeled as “Safe Funds” and “Monthly Income Plans” which Indians like to hear a lot.

“Look what happened after the abolition of entry load in mutual funds in 2009 .  From the last 1 Year, the corpus of MIP schemes have seen a huge inflow all over India. Last year, the total industry AUM was close to Rs. 3700 crore and today it is well over 24500 crore. In this entire period, equity funds AUM have gone down. Now when the intentions itself are not good, needless to say that the outcome will be right. Many investors are not aware that there is an EXIT Load of 1% in almost all MIPs if you were to withdraw before one year & in some cases even 1.5 years.” – says Hemant Beniwal on this Forum post

Taxation of MIP’s

MIP’s are debt funds and hence the taxation is same as debt funds .

Short Term Capital Gains: Any profit before a year would be Short term capital gains and it would be added to your income and taxed at your slab rate. So for investors who are in higher tax slabs it would be wise not to sell their MIP’s (in case they can) before a year, else there will be a good amount of tax on your profits.

Long Term Capital Gains : Any profit you get after 1 yr in MIP would be taxed at 10 per cent without indexation or 20 percent with indexation, whichever is lower.

Short Term and Long term Capital Loss : The best thing about MIP’s over FD’s or Post office schemes is that incase you have any loss in MIP’s , you can set it off against the capital gains in the same year or in next 8 yrs , which makes sure that even losses can be used for tax saving purpose.

Dividends : All the dividends received from the MIP’s would be tax-free in the hands of investors,  but note that companies already pay Dividend distribution tax from the MIP’s

Read more on Short term and long term capital gains

MIP’s save money for bad times

Think about ants! They make sure that they save enough food for the rainy season, so that they don’t fast in bad times. In the same way MIPs do not declare all the earned income as dividends, instead they declare a part of earned income as a dividend and save rest for troubled times in future.

This makes sure that when there are bad days in future and MIPs do not see much growth, they can use the money saved, to declare dividends. For instance, in 2008, despite bad markets, 19 funds skipped only up to four monthly dividends.

However, a lot of MIP’s didn’t perform that well and could not save the part of earned income in a proper way. Hence they had to skip all 12 months dividends. Eg., Canara Robeco MIP Mn Div, which skipped all 12 dividends in 2008 and 9 months dividends in the year 2009. See the chart on the right to get more insight into how MIPS missed their dividends. Source: LiveMint

Beware: There is one more option called dividend reinvestment in MIP’s apart from Dividend payout and growth . If the payable dividend is less than Rs 250, then the dividend would be compulsorily reinvested.

Who should Invest in MIP’s ?

1. Investors looking for regular Income

If you are retired/semi-retired or just looking to generate some regular income can look at MIP’s as an option. Note that instead of choosing a monthly option of income, I would rather suggest a quarterly or half-yearly option .

2. Conservative investors looking for better returns

Are you a conservative investor but still looking for better returns than pure debt options like Fixed deposits or Insurance policies? Well, you can’t get 100% safety with MIP’s, but there are very good chances that you would be getting better than FD returns with MIPs.

3. Investors who want to park a big sum of money

A lot of people have questions like “Where to park my lump sum money for medium-term with lower risk ?” If your horizon is very less – like 6 months or a year, MIP’s might not be the best option, but if you want to park it for 2-3 yrs with low risk, MIPs with growth option can be a suitable instrument .

MIP vs Fixed Deposits/ Fixed Maturity Plans/ POIMS

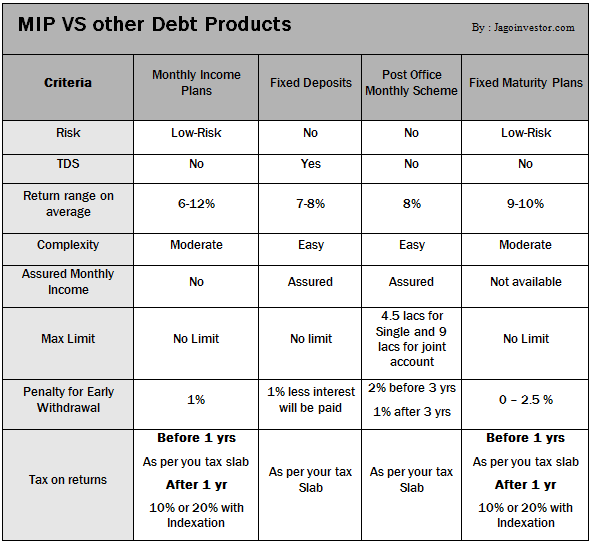
You might get confused between so many debt products and might be wondering how Monthly Income Plans compare to Fixed Deposits (read this post by Deepak Shenoy) , Post Office Monthly Income Scheme or Fixed Maturity Plans (FMP) . There are various parameters on which they all differ . Below is the chart which shows you those differences .

Monthly Income Plans , Best MIP for Investments

Two ways of getting income from an MIP

We will see two different ways of generating monthly/quarterly income through MIP’s Monthly. One is the regular way of choosing a dividend option and the options one is starting a Systematic Withdrawal Plan from MIP after a year of buying it. Let’s look at both and its pros and cons …

1. Choose dividend option

The good point in this option is that you will start getting the income immediately as the company starts declaring the dividends, and you don’t have to take care of taxation issues. However, the bad side is that eventually 14% dividend distribution tax would be paid by the company and the stability of income will depend on how often dividends are declared by the company. If they skip the dividend you will not be getting the income for that month/quarter.

2. Choosing growth option and start SWP  (Systematic Withdrawal Plan)

If you use a bit of strategy, you can create a more stable and more tax efficient income by this method. You can choose growth option in MIP and after 1 yr you can start a SWP (systematic withdrawal plan , opposite of SIP) from your MIP to your bank account . What will happen with this option is that you will not have to depend on companies dividend announcement , as it’s your decision to liquidate a fixed part of your MIP’s, sell it and get the money in you bank account . Also as you are doing it after 1 yr, there wont be any exit load and the profits you get out of it would be Long term capital gains , so you only pay 10% on the profits (assuming you don’t want indexation benefits), which is 4% lesser than the dividend distribution tax . If you have a large amount of investments in MIPs, then this option can save some tax for you, but if your investments aren’t significant enough, it’s not worth the hassle .

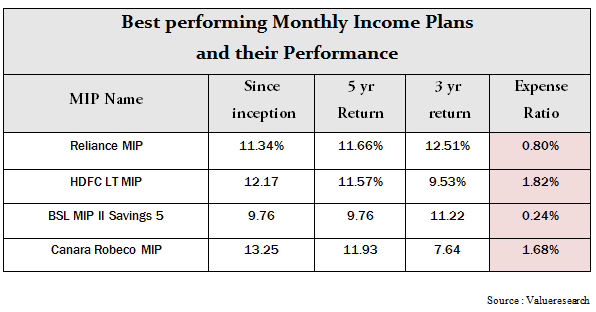
Some best performing MIP’s  in Market

One of the readers Sagar asked his query on our forum: “Which is the best Monthly income plan ?“. While there is no guarantee that the MIP which you choose today will keep performing well always, but I have got a list of MIP’s which have done excellent in past and still look good. You can choose any of these if you are disciplined enough . Once you choose them make sure you concentrate on regularly investing in them without looking at their performance every week or month. Just review them in a year or so . watch out for the expense ratio of the MIP’s, lower the better

Monthly Income Plans , Best MIP for InvestmentsConclusion

So the main takeaway from this article for you should be to understand that MIP’s can be good alternative for you if you have been investing a lot in Fixed Deposits and do not mind taking small amount of risk. Another important point was to look at MIP’s are income-generating products with understanding that sometimes the income can go for a toss in between and you have to comfortable with that.

I would love you hear your comments on monthly income plans and do you feel that it can be helpful in your portfolio , share with us !