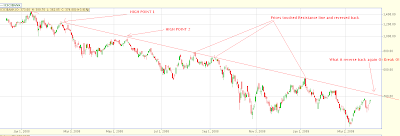
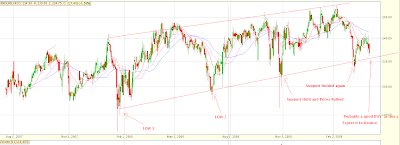
Value Investing by using Nifty PE

Let us see some analysis of current market conditions. Most of the people are rushing to buy now for long term . but this may not be a market to buy for long term. I am myself Bullish now, but for short term not long term.

Nifty PE

I would not be surprised to see markets rise by over 10-15% more over next 1-2 months till the Budget  but sooner or later I expect.

– A nice correction if this is another bull market
– Bull rally coming to an end in the strong bear market

The simple analysis is with a simple and strong tool called PE ratio. PE ratio tells us how expensive or cheap is the current underlying. In other words what kind of value does the market provide us , irrespective of the price.

Historically Nifty has been considered and shown instances of being oversold in range of 10-13 and overbought in range of 20-25. Nifty has had a crash after after getting in the range of 20-25 and have rallied after touching the range of 10-13 .

OVERBOUGHT MOMENTS in Indian Markets
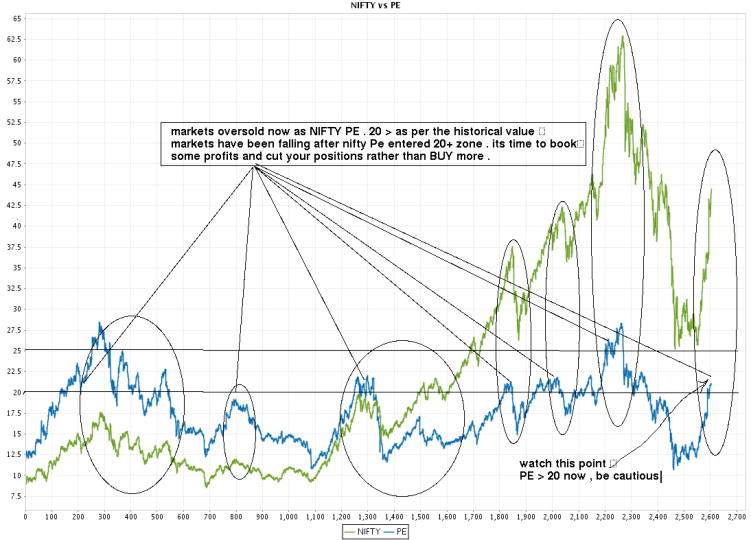
nifty vs PE

Click to enlarge , Data for last 10 yrs (Jan 1999 – 31st May 2009)

You will see that whenever nifty crossed 20. It was time to be cautious. its not exactly the time to go short sell, but at least book your partial profits and be cautious with further buying for long term.

Current situation : As I write this, Nifty PE is around 21. Its not a very good situation to madly buy for long term. Its a time when euphoria is at high point and it can take markets a little further. So you can jump in now with short term perspective, not long term !!, because markets may fall in some weeks or months.

Expect it. but don’t force it !! .

To get any future Posts , why not Subscribe to Get Posts in Email or RSS Reader

OVERSOLD MOMENTS in Indian Markets

Who all missed the current Rally? I missed it. there are two reasons, I am a trader not an investor for long term (at least currently).

So I do not concentrate on it. But you could have not missed it if you had read this concept earlier and had the guts to go against the so called “experts on CNBC” who were talking about 5k or 6k for NIFTY some months back.
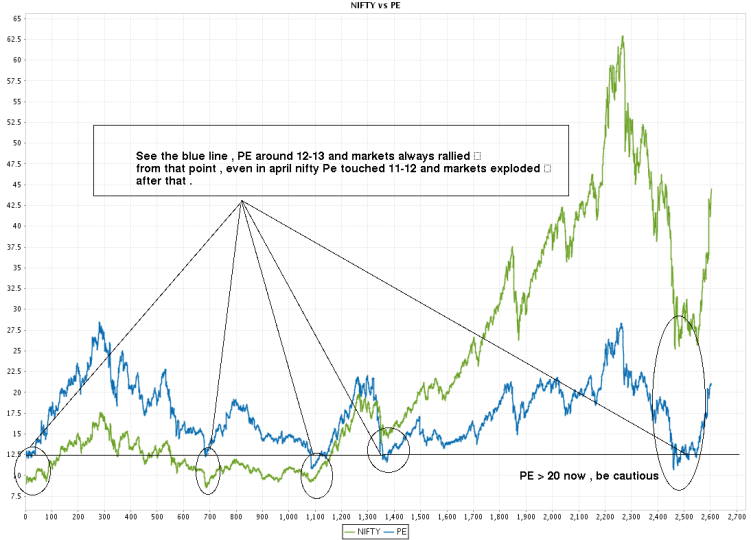
nifty vs PE

Click to enlarge , Data for last 10 yrs (Jan 1999 – 31st May 2009)

If you see the chart, you can see that after touching the PE levels of 11-13, markets have rallied back as it was too oversold !! Again, just touching these levels of PE does not signal a BUY, its only a signal to be cautious and make your mind for long side, and start the accumulation process without fear.

Markets will still make lower levels and experts on CNBC will still cry over economy conditions and world coming to an end. But market rewards the “risk assumption”, not the actions on obvious facts. You also have to decide how much money of your portfolio would you like to put in stock market after considering your risk-appetite.

What can we learn from this PE Concept?

“We can learn from history that we do not learn from History”

This is true for almost 95% of the long term investors all over the world. They do not learn things, they do not do any research, they do not go and read blogs or tons of informational sites, they just want tips from others and make money. the mathematical expectation of that kind of investing is negative and cant work for long term.

Lets develop a simple concept of PE based Investing. here it is:

BUY Signal : Once PE crosses below 13.

When NIFTY PE reached levels of 13 , start accumulating the stocks and invest your money in 4-5 installment over some months. Make sure that markets are going up and down and moving in a range . If PE crosses below 11 , its a must BUY !!

SELL Signal : Once PE crosses above 20.

Book the profit once NIFTY PE crosses above 20, Don’t book all profits at once. Book it in parts. PE crossing above 20 does not mean markets has to fall, its only an indication that markets may be oversold and now “smart people” will starting selling there shares to mad public.

Short sell the shares once PE and Markets start falling down from PE levels of 20. If PE crosses above 25, its a must SELL !!

There have been cases of PE going up to 25-28 levels. That will happen at the peak of strong bull markets like Jan 2008. In very strong bull markets you have to understand that PE will cross even above or below its extreme points. That’s the risk part of stock markets from which not even GOD can save you from !! 🙂

This is the time when your buying in parts and putting capital which you can afford to loose will help !!

Anyone who puts 100% of there money in stock market at once on one single time on a single bet has a secret affair with financial disaster which he/she himself is not aware of. So don’t put all your money at once. Only put a part of your capital at any point .

Where do you get the PE data for Indices? (Nifty and other Indices)

NIFTY data : https://www.nseindia.com/content/indices/ind_histvalues.htm

PE data : https://www.nseindia.com/content/indices/ind_pepbyield.htm

Note :

  • I have divided Nifty Value by 100 to make the graph look the way it is . In graphs , so on X axis if you see 40 , then read it as 4000 for nifty . but exact 40 for PE .
  • PE value will be separate for individual stocks as PE ratio for stock can go up or down for many other reasons . So if you are doing Stock analysis , see its historical PE values and find some pattern yourself . Innovate !!

I hope you have got a clear idea about Nifty PE. If you still have any confusion you can leave your query in our comment section. Also do let us know your opinion about this article.

Short Review of few Mutual Funds

I did a short and crisp review of some mutual funds for a friend . thought of sharing this here.

Franklin India Prima Fund – Dividend

151/208 138/157 61/75 are the ranks for 1 ,3 and 5 year . Not a great one to cheer about .
Risk Grade: Above Average
Return: Grade Average

Tata Infrastructure Fund-G

Not a very old fund but its a good one. Infrastructure space can be a big hit considering 4-5 yrs time frame and with the blessings of UPA. Better diversify money in this space along with other infrastructure Mutual Funds.

With 25% CAGR returns since launch , its looks good.

Franklin India Flexi Cap Fund – Dividend

Numbers look good but there are better funds available.

Birlasunlife Frontline Equity Fund-Growth

Extremely good fund to have in portfolio. It has shown strong performance in all the time frame of 1 ,3 ,5 yrs and 30% CAGR return since launch. Better to stop Franklin India Flexi Cap Fund and redirect the money to this one.

HDFC Equity Fund – Growth

Again a good fund to have in portfolio.

What would I do If I were at your place.

– Stop Franklin India Prima Fund
– Stop Franklin India Flexi Cap Fund – Dividend (5k)
– DSPBR Equity or DSP Black Rock top 100 or HDFC Top 200
– Increase your Exposure in Birla Sunlife Frontline Equity Fund
– Share your 10k in UTI Infrastructure and Tata Infrastructure

Do you know difference between Divident and Growth options in mutual funds ?

General Recommendation

  • If the investment is for long term wealth creation dont go for Divident option
  • Monitor and review your mutual fund once every 6 months
  • Not sure if you are allocating money in mutual funds after understanding your Risk-appetite or not . Check that out, No Debt side ?
  • Do not have more than 5-6 mutual funds
  • Look at other sectoral mutual funds on banking and financial sector with long term view

look at a video explaining how to choose a mutual fund

Subscribe to jagoinvestor SMS channel to get updates on your mobile

Disclaimer : Information taken from valueresearchonline.com and analysis and views are personal

How different Products can yield different post tax Returns?

This post will teach you how to take advantage of different products tax rules keeping in mind your income tax bracket. Different products can yield different post-tax returns for people in different tax bracket. FD’s return can be 7.2% post tax for you, but may be its 5.6% for me 🙁

Lets take an example to understand this post.

How different Products can yield different post tax Returns?

Two of my friends Ajay and Robert asked me what should they invest in for 2 year. They have Rs.1,00,000 to invest.

I recommended following products to them :

Ajay : Fixed Deposits
Robert : FMP’s ( Read what is FMP’s )

You must be wondering why did I suggest different products to them? Both have same risk-apetite, Age etc.

The answer lies in there tax bracket. The post tax returns depends on your tax bracket too. Lets see how.

Ajay Case

Ajay does not earn much, His annual income is less and he falls in 10% bracket.

Tax treatment of FD’s interest : Returns are added to your income and then its taxed as per your tax slab rate.

Now it means that tax on FD’s for him would be just 10%. Considering 8% interest.

Interest Received = 16,000
Total Tax paid = 10% of 16,000 = 1,600
Total Return = Rs 14,600

Robert Case

Robert earns well and falls in 30% tax bracket, hence FD will not be best for him, He will have to pay 30% tax on the Interest for FD.

Tax treatment for FMP’s : For Long term capital gains (more than a year), the returns from FMP’s are either taxed at 20% after Indexation or 10% without Indexation

Assumption : Lets day FMP’s provide indicative returns of 9% and lets also assume that they actually provide that return. then

Investment = Rs.1,00,000
Interest = 18,000
Interest = 10% of 18,000 = 1,800
Returns = 16,200

Note : I have not considered tax after indexation, please do it yourself. read this, Anyways it will be more than what he is paying without indexation.

Read What is Indexation Benefit ?

Why FMP’s were not better for Ajay ?

you might think that Ajay could have gone for FMP’s too. The returns are almost same and tax is also same, But you have to realise that FMP’s returns are not guaranteed ,they are just indicative.

Also FMP’s carry Default risk , then why to take extra risk, The only advantage he would have got is .5 or 1% extra returns but at the cost of the risk, which is not worth.

Why FD’s were not better for Robert?

Now this you know , obviously the tax to be paid on it would have been 30% as Robert tax bracket is 30% and hence he might have paid 30% tax on the returns from FD’s

Conclusion

So now you understand that a product can yield different post-tax returns for two people in different tax bracket

So when you do your investment planning, you must take these small details about tax, If you choose your investments considering your post-tax returns, you can make much better decisions, how ever this should come after an investment passes the 4 most important aspects of investments and GFactor basis .

I have started active blogging on my Technical analysis and options blog, I have suggested to go long in Satyam, Please read it.

Go long in Satyam
Detailed Analysis on Satyam

I came across a very good article called “What the IPL taught me about Investing”


How to Calculate Net Present Value (NPV) and how to use it?

In this post we will talk about How to think and calculate Net Present Value of a transaction involving Financial Payment, and why its important to understand the concept.

net present value

Consider the following Example :

You have to lend Rs 1,00,000 to one of your friends and He is offering you following choices.

Choice 1 : He will pay you Rs 18,000 per year for next 10 yrs.

Choice 2 : He will pay you 13,000 per year for next 15 yrs.

Choice 3 : He will pay you Rs 8,000 per year for whole life.

You have landed on the most read article of this blog For this month, Make sure you Get updates on Email or Join Our Facebook Page

Which one should you choose?

Here you have to take a decision of choosing from one of the choices. The logical decision here will be to go for choice whose Net Present Value is Highest. You have to understand the time value of money. Rs.10,000 received today is much more valuable than Rs.10,000 received 10 yrs later, even Rs 15,000 received after 10 yrs.

So you have to see that which choice has the highest worth if you calculate its Value today.

So how do you calculate the Net Present Value in this case, where you have Rs X receivable every year for n years. Here you also have to consider present rate of returns which you can assume at 8%.

So We have 3 variables

X : Amount received per year

n : Number of years

r : Present rate of return

NPV = X * [(1+r)^n – 1]/[r * (1+r)^n]

Calculating through this formula, we get the Net Present Value of the choices as

1. 120781

2. 111273

3. 100000

Net Present Value of the last choice is simple , how much money do you put in bank today that will fetch you 8,000 per year forever? If X is the amount than at 8% interest you get 8,000, so

8% of X = 8,000

.08 * X = 8,000

X = 8,000 * (1/.08)

X = 1,00,000

If you see the total amount received in all the cases you will realise that the choices with lesser NPV will give you have higher Total amount.

For Case 1 : NPV = 120781 , Total amount received = 1,80,000

For Case 2 : NPV = 111273 , Total amount received = 1,95,000

For Case 3 : NPV = 100000 , Total amount received = Infinite (The amount is paid forever)

Calculate NPV for your self, see this calculator

But you have to understand that “Total amount received” is not important. What can you do with the money is more important? So the real Indicator is Net present Value of Money. You have to understand the Difference between Price Vs Value. Price is what you pay, Value is what you get. Value is important not Price.

Real Estate Case

If you go for a home which cost Rs 50 Lacs @9% Interest for 20 yrs. Your EMI will be around 45,000 per month.

I found this amazing Apna Loan , EMI calculator, Its nice

You will actually pay total of 45,000 * 12 * 20 = Rs.1.08 Crores.

Now you may feel that the cost of house is Rs.50 Lacs ,but the amount outgo is actually 1.08 Crores and may feel bad for this, But this is ridiculous. Because you are not paying 1.08 worth of money in your entire tenure, 1.08 is just a number.

Its worth is still 50 lacs only spread over 20 years and the numbers sum up to 1.08 crores.

If you calculate NPV of the Home loan money which you are paying , its exactly 50 Lacs . Calculate it with (.75% interest and 240 as tenure, as its a monthly and not yearly) .

Note : There can be other situations also where we need to calculate Net present value with a different formula, but for this post we are only discussing the examples and scenarios where you need to pay or receive a fixed amount after every fixed period for some tenure.

Conclusion :

You can also use this concept for taking decisions in scenarios where you have different choices of payments, choose the one which has lowest Net Present Value, like in the example we took , For the friends its more beneficial to go for the 3rd option.

So the moral of the story is that dont pass this post link to your friends with whom you have financial relations 🙂

Questions?

Should Banks state net present Value of the money customers pay as loan , so that people come to know that they are getting fair value for there money?

Read interesting note on Home Loan EMI, Read how Home Loan EMI is Calculated?

Readers, are you getting a horizontal scroll bar when you view this blog? If its irritating for many people I will fix it? It depends on your computer resolution how does it look to you, for me, it works fine.

How to Calculate Capital Gains and What is Indexation ?

In this post we will learn How to calculate Capital Gains or Losses. A lot of people make mistake in this . If you buy a house in 1995 at Rs.10 lacs and sell it at Rs.20 lacs in 2009. On how much profit will you pay the tax?

If your answer is Rs.10 lacs , you have no idea how to calculate capital gains. Read ahead to understand .

capital gain

What is Capital Asset ?

Capital Assets are the properties which can be held by a person . Some examples are Real Estate , Shares , Mutual Funds , Gold and Debt Funds. FD’s and other fixed returns Instruments are not part of it.

Taxation

For taxation of Capital Assets , read this : How to use your looses to Reduce Tax

How to Calculate Capital Gains ?

Most of the people think that

Capital Gain = Sell Price – Purchase Price

But , Actually the real formula is

Capital Gain = Sell Price – Indexed Purchase Price

What is Indexation ?

Indexation is a technique to adjust income payments by means of a price Index , in order to maintain the purchasing power of the public after inflation.

We must understand that prices in general also rises, so the actual prices should not be used while computing the profits , rather It should be Indexed as per Inflation in the country, so that people can get the real value from sale of there assets.

Indexation is used in Tax treatment for Debt , Gold and other asset classes

What is Cost Inflation Index (CII) ?

Year CPI
1981-82 100
1982-83 109
1983-84 116
1984-85 125
1985-86 133
1986-87 140
1987-88 150
1988-89 161
1989-90 172
1990-91 182
1991-92 199
1992-93 223
1993-94 244
1994-95 259
1995-96 281
1996-97 305
1997-98 331
1998-99 351
1999-00 389
2000-01 406
2001-02 426
2002-03 447
2003-04 463
2004-05 480
2005-06 497
2006-07 519
2007-08 551
2008-09 582
2009-10 632
2010-11 711
2011-12 785
2012-13 852

How to Calculate Indexed Purchase Price ?

Indexed Purchase Price = Purchase Price * (CPI for current year / CPI for year of purchase)

Once you have Indexed Purchase Price , you can subtract it from Sale Price and get your capital gains .

In some products Long term Capital gains is around 20% with Indexation and 10% without Indexation. In Equities Long term Capital Gains is exempt from Tax .

Let take an Example

Purchase Price 1000000
Year of Purchase 1995
Sale Price 2500000
Year of Sale 2008
No of Years 13
Purchase CII 281
Sale CII 582
Indexed Purchase Price 2071174
Capital Gain 428826
Tax with Indexation 85765
Tax without Indexation 150000

I hope the above example is clear . Below is the calculator I have created for you to calculate Capital Gain tax for your self. Just play with different numbers . Just enter the year of Purchase and Sale and It will figure out the CII (incase it does not, please put CII yourself)

Capital Gains Calculator
I have made a Calculator for you : https://public.sheet.zoho.com/publish/manish.pucsd/temp

Capital Gains Tax with Indexation and Without Indexation

There are some asset classes where you have the choice of using Indexation or not . This is true for debt funds and FMP’s. So the current rate is either 20% with Indexation or 10% without Indexation for Long term Capital Gains .

For Tax without Indexation, you simply find out normal profit (sale price – cost price) and then calculate the tax.

So you can calculate tax using both ways and then choose the one which is lower 🙂 .

How to save your Capital Gains Tax?

For people who are miser and do not like to pay lot of taxes , govt has provided some relief to them. Govt says that If you don’t want to pay tax on your capital gains, you can do following things to save your taxes.

Invest your Capital Gains in Real Estate: If you invest your Capital Gains in Real estate within 2 yrs, you will get the the exemption.

Invest in Capital Gain Bonds : There are some specific bonds issued under sec 54EC, some of them are NHAI or REC bonds. You have to invest in these bonds within 6 months. Generally the lock in period is around 3+ yrs. interest on NHAI or REC bonds is around 5-5.5% .

Tax on Capital Gains can be different for different People

Please note that Capital Gains tax can vary from one person to other person depending on which tax bracket he/she belongs to. It will also depends whether Tax with Indexation or without Indexation works out to be cheaper for him or not.

Note : For calculation purpose the Financial years are business year from April – Mar, Not Jan – Dec. If you buy in June 2009 and sell in Jan 2010, you are in the same year not 2 different years.

Conclusion

So, In this post we learned how you can calculate capital gains and also take advantage of tax benefits for saving your taxes on capital gains, Your aim should be to understand the process and learn about it, so that you can take informed decisions in your financial life .

No one should take advantage of your ignorance and also to take quick decisions and make rough calculations when there is a need. If you know these rules, you can take better decisions

Questions for you

Suppose you are age 30.
– In June, 2000, You buy 20 lacs Home
– In Aug, 2007, You buy stocks worth 10 Lacs
– In April, 2008, your sell your house at Rs 30 lacs
– In June 2008, your stocks have gone down in value are worth Rs.3 lacs now.

What should you do to avoid paying any tax on capital gains made from House?

In previous post I have discussed “What is NPS , New Pension Scheme” by Govt of India . Read it

A day in the life of a stock trader – Part II of the series of “Profile of a Day Trader”

This is a guest Article from a fellow blogger friend and a very good Technical Analyst, Nooresh Merani. This is an interesting article where he presents how a profile of a Day trader looks like.

day trading

A part of this article was published in May 14th Issue of Money Today Magazine. I hope it would be a good read for everyone , Even If you are not related to Trading , you will come to know what is Day trading and how it can be a full time profession and very rewarding one . Read the article Below .

THE JOB = Day Trading

Job description: 6 hours a day / 5 days a week which requires hardly any physical activity apart from grunting or swearing in anger or thumping hands, tables and chairs in happiness.

Desired Profile: The desired candidate should be good at accounts and quick at using the computer keyboard or mobile keypads. No formal education or age bar.

Company Profile: It’s one of the oldest organizations (BSE is formed in 1875!) which is open to all candidates provided they have capital to trade with.

Remuneration: The salary has no upper limit but the candidate has to forego a small amount as brokerage/ taxes on the transactions.

The above job description seems a dream job!!

The profile of a day trader is not as rosy as it seems as they don’t have a fixed salary, instead they have to risk a security deposit (trading capital) paid up with the company (exchanges/brokers) which may be blown off in few hours, days or weeks or years.90% of Traders pay salaries for the rest 10%.

Trading is one serious business and a highly disciplined profession but, a large section of traders who don’t have this attitude get thrown out of the system very quickly. A trader learns from the mistakes, accomplishments through his trading career and by honing his technical and intuitive skills.

Initial grind:

Every traders goes through the initial grind (sometimes recurring) of losses, depression, self -realization and more.
A must Quote for every traders’ desk, “People who learn from their own mistakes are Wise, People who learn from others mistake are Wise and Lucky and, those who do not learn at all are Traders (Suckers)”

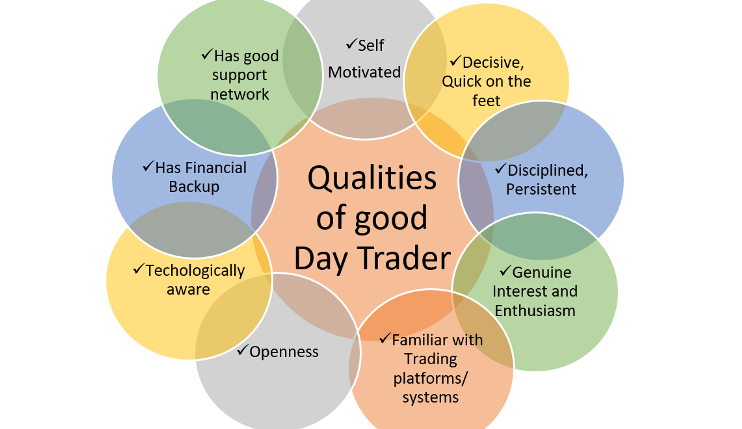
qualities of a good day trader

So, to be successful in trading, the most dynamic profession, where even a richest man can’t afford an hour’s lunch break (the Gujarati Thali would cost somewhere in Lakhs!!), one needs to learn, evolve, adapt and be disciplined. Always learn from the past, apply it to the present so that you can gain in future!!!
A Traders Day!

Pre-Morning work:

First thing a trader checks is how Dow Jones, European indices performed overnight and the current situation of Asian markets. SGX Nifty in Singapore opens up much before India so a trader gets hint of Nifty opening.

The trader makes modifications to the stock lists and observations made for the day. Technical, Pivot and data traders are ready with a list whereas system traders rev up their mechanical engines which generally don’t deliver much.

Trading Hours:

Although every trader has to see the ticker on his computer monitor for prices, but, there is a section of traders who only rely on ticker reading, which is a study of price & volume fluctuations. For best results, a combination of intuition, ticker reading and knowledge of technical analysis is a must.

Indian markets are one of the most volatile ones and it’s a common saying out here – Nazar hati durghatna ghati (Moment you get your eyes off you will meet with an accident). So a trader has to be attentive and nimble footed to make split-second decisions and follow the personal trading style/rules.

Post Trading Hours:

This is the best time for the trader to catch up on a snack or freshen after finishing of the calculations and noting down the open trades or the profits made in the day.

Analysis and Self-Evaluations:

The amateur traders don’t realize that this part of a trader’s life is equally important. Technical traders go through their charts; mechanical traders test their system to come out with a list of possible stock trading ideas for the next trading session and evaluate the current positions.

Trading as a profession has the most ups and downs with terribly bad trading sessions and equally high performance sessions. Every trader needs to keep evaluating, modifying and optimizing their trading styles to stay in the loop or the market knows a way to kick you out.

Latest Experience with the Screen!

Although I and many of us traders do follow the above plan but human nature is frail and one does make mistakes. One thing I have realized with experience is if you make a cheap mistake (small loss) early you would make a killing next time around by not repeating it.

The last mistake I made off late was to pre-empt and anticipate a big down move in 2nd week of March which didn’t come but luckily got saved because of stop losses and the screen. The next time around I did the simpler thing of re-acting to the ticker sense.

My one such encounter with markets was on 15 April 2009 when Indian indices outperformed global indices.

Many traders were yet again caught on the wrong side of the trade by watching the performance of Dow Jones overnight.

The index opened lower and drifted lower. But, ticker did not show signs of weakness and out of index counters continued to gain strength. What lot many traders missed out was, that Hang Seng (Hong Kong) was up 600 points on 14th March, the day Indian markets were closed due to a holiday.

Any technical analyst would confirm Hang Seng bears the closest co-relation statistically with India. So, this simple observation kept my bias bullish though the index was negative to start with.

The ticker was purely biased towards the mid cap segment in the last few sessions so my focus was on them.

We kept on holding to the previous open positions (namely Crompton, ks oils, guj nre, gtl infra, ghcl).

Also, seeing the momentum, added on to my technical picks Dishman Pharma, Everonn & Crompton for the day at higher levels then opening which gave awesome moves of 10% + in the day!!

Sensing that the up move was backed by nervous morning sellers squaring up, we booked out of previous positions to reduce the risk exposure and raising stop-losses to cost to conserve gains. A combination of aggressive buying along with disciplined money management did the trick as index closed 200 points lower the next day.

The learning from above experience was “Respect the Screen & Markets are Supreme”. A Trader looks for intuitive hints from the screen and doesn’t ask why it’s performing so, but, just follows it on the path to making money.

Above all would like to end this with few words of wisdom in Gujarati – Market Ni kamai market ma samai – (Money made in the market, stays in the market). A wise trader makes money and takes it home regularly!

Happy Trading!

Nooresh Merani , Analyse India

Blog: https://nooreshtech.blogpost.com

Website: www.nooreshtech.co.in
Email: [email protected]

The Internal Analysis of Akruti Crash

Numbers and Graphs Speak.

I thought of starting my articles from some Analysis on Akruti City Crash .

In this article we will learn , how can we before hand get some idea about events like this and have clear picture of whats going on .

See my previous posts on Warning about Akruti City : Post 1 , Post 2 , Post 3

– Lets see 2 yrs old chart first


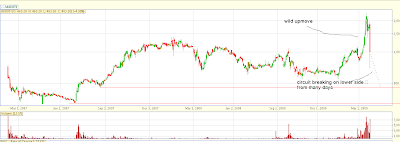
If you see the chart you will see the steep rise in prices in last month , you can also see that its was not a normal price movement , when compared with previous movements .

For a closer view , lets see 3 months charts


If you see the chart you will see ,that prices moved up crazy and then crashed in two stages .

First Downmove : This happened because of the news that SEBI is excluding it from F&O segment . (If you dont know F&O , dont worry) .

Second Downmove : Second downmove came near 25-26 Mar , when it was F&O expiry . What happened ? Lots of positions were built up in F&O and after a sharp upmove , everyone rushed to get out as fast as they can , at any price . So selling pressure came in and prices tanked 45% .

See High Volumes in the month of March (3rd half of the graph) . Suddenly there was so much participation . Most of the buying which was happening on this stock was not for long term basis (delivery basis) .

What is Delivery Basis : delivery buying means , people actually get the stock in there demat accounts , it simply means its delivered physically to there account , But when you buy in the morning and sell the stock in evening , then its not delivery basis . you just make profit or loss same day .

Lets understand an important concept called “Deliverable Percentage” , which simply means , percentage of shares out traded shares which are actually delivered .

So if its higher , it means that most of the buying and selling is happening for delivery basis and people want to keep it with them for some time , When its too low , it means lot of trading (speculation) is going on to catch the pie in the price movement and hence its not sustainable most probably .

Example :

So , for some XYZ company , if volume is 100 shares and and deliverable % is 50% , it means that 50 shares where delivered and 50 were speculated , which is normal ..

But if its 20% or 10% , then things are fishy , there is no value buying happening and shares are just exchanging hands from one to another where each one wants to sell it at higher price , also there are people who want to buy the shares at higher price , because they know that there will be some idiot who will buy from them at much higher price to continue the madness .

And when it ends then what happens , There are no buyers !! , every one has sold at lower prices and then suddenly the selling madness comes in and the bunch of people who get out first (at higher prices) make the most money . And in this pressure everyone is ready to sell at a lower price than someone else .

You can easily imagine that day price movement , see 26th Mar downmove of 45% crash .

So how do we find out that this is happening , Is there some place we can get data from , and the answers is nseindia.com website , it has all the information on needs to know .

Source : https://nseindia.com/content/equities/eq_scriphistdata.htm

Go here , choose 3rd radio button (Security-wise Price volume & Deliverable position data) , and choose share name and dates for which you want data . You will get all the data .

You must see “Price” , “Total Traded Quantity” , and “% Dly Qt to Traded Qty”, you will get good idea at looking it .

But I will not leave you with boring looking numbers . I have taken the AKRUTI data for 3 months (Feb 1 – Mar 27) and then smoothed it with 5 period moving average for each of them and then plotted it on graph , so that you can get the picture pretty well .

The points do not represent the actual value , it only shows you the relationship of each other . see the below graph .

If you enlarge the chart , you will see this relationship

Price : Prices picked up and start moving up . (Orange line)

Traded Quantity : You will see how it started moving up wildly and picked up a pick high speed in March (3rd half portion) (RED line)

Deliverable % : you will notice that it started going down and down , which indicated that even though Traded quantity is going up and up , the delivery is not happening , which means lots of speculation , which is an indication of a building of Bubble which can burst anytime .

So whats the learning , If you see Price movement in one direction and see Rising Traded Quantity and falling Deliverable % , you should suspect the move . It is normal to some extent , but an extra ordinary move is truly suspectable .

And whats happening now to Akruti ?

from last some sessions there is no buyer , only sellers are there and from the peak price of 2100 levels , its now down to 380 (at the time of writing) . I had already warned of this long back , dont take it as any success in prediction of stocks 🙂 .

If you see the current Volumes of Akruti , it was 2137 on NSE , where as average volume was at 4.5 lacs !! , Which means that this down move is not supported by volumes , (watch volumes in 2nd chart , you will see nothing) .

Its just the fear of handful traders who have no idea why they are selling . So we can again expect some wild moves on upside in future when prices starts picking up .

Conclusion : When you see prices moving in one direction without any great fundamental change or significant news , You can use the numbers and see there relationship and you will see something which most of the people have no clue about .

Disclosure : I had learned this technique from Mr. Sunil Saranjame blog , timamo.blogspot.com , an excellent market reviewer as per my thinking . So credit goes to him .

Please join jagoinvestor google groups , see the upper right area at the start of the page , I will be sending instant notifications about the post and we can also share options trades there or some other stock trades when there is good opportunity . Also who all have not left there comments/suggestions , please do so on the suggestions/comments post

I also Introduced my self in the last post , see My Introduction

How to use Oscillators to BUY an SELL

Hi

This is 4th part of the “How to be a better than average Investor” series of articles. Today’s lesson is on Oscillators .

What are Oscillators :

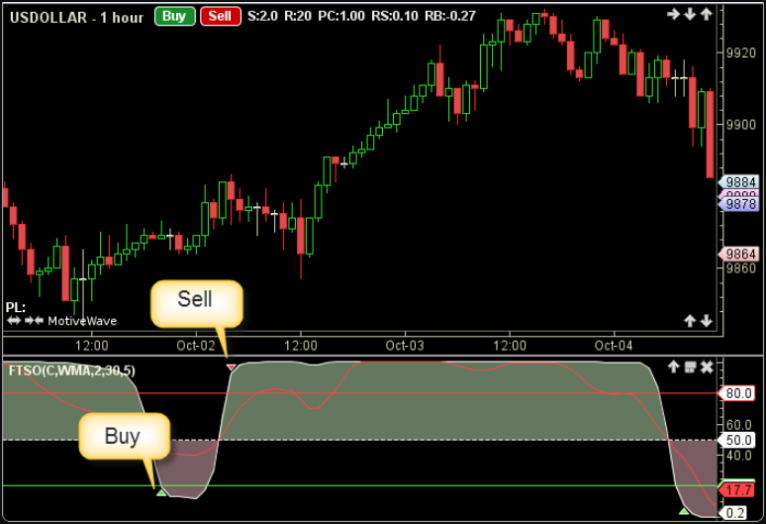
Oscillators are the indicators which move from overbought to oversold area, generally from 0 to 100. when they are nearing 100 it means stocks are overbought and “expected” to go down now. when they are nearing 0, it means, stocks are in oversold area and fresh buying can come and move the stock up.

Oscillators

hey .. wait a min, did you vote on the poll upper right side, I have asked on what all topics do you want me to write. Please select topics from them, so that you also get to read your favorite thing some time 🙂 cheers … go ahead ..

I will discuss just 2 oscillators which Investors can use to make better BUY AND SELL decisions.

Let take a time frame of 6 months and see how indicators gave signals of buy and sell. We will see 2 indicators here RSI and Slow Stocastics (SS) (Read what is RSI and What is Slow Stocastic ).

Rules

When it’s overbought, we SELL the share.
When it’s oversold, we BUY the share.

SS BUY signal = when blue color line crosses down the Red line.
SS SELL signal = when blue color line crosses above the Red line.

RSI BUY signal = when RSI has moved below 30 and starts moving up.
RSI SELL signal = when RSI has moved above 70 and starts falling down.

To make signals more stronger, we will use both the indicators signal and take BUY or SELL only when both shows same kind of signal.

OVERBOUGHT = when RSI and SS both are overbought
OVERSOLD = when RSI and SS both are oversold.

Note

At any point of time, markets may be in any of 3 state.

– Uptrend
– Downtrend
– Side ways Movement

Understand that these signals work best in range bound market, like we had for last 6 months. When market were moving in range of 3100-2600. If markets are in strong Uptrend or Downtrend, these indicators will generate many false signals.

Hence, In different markets we have to use different strategies.

Uptrend Market : IN Uptrend, you should avoid selling the stock, when there is small correction, Indicators can fast move in oversold region, that is the time you should BUY. But not SELL when prices are in over bought market.

Downtrend Market : In Downtrend, you should avoid Buying the stock, only SELL when the indicators are in overbought region .

Sideways Market : In this market, you can buy and sell both.

Lets see some examples for last 6 months. This was a Sideways market (but still downward bias was there, so be careful with BUY, you can take SELL easily).

DLF Chart

ICICI Chart
RELIANCE CAPITAL


Some Important things to NOTE (very important)

Oscillators should not be used in Isolation alone, You should also confirm it with other things like Support and resistance to make your BUY or SELL more stronger.

For example : If prices are near the Overbought, but you see that prices have broken the resistance point, its tells you that you should not BUY. because Oscillators are secondary thing, prices are primary.

Also, If prices are near support and not breaking it, and oscillator are in over sold area, then its safe to BUY. Never rely just on Oscillators, they are only helping tools used with other signals.

Lets see one Chart of JaiAss for testing what you have learnt.

Questions for you

– Tell me where are the buying and selling opportunities.
– Tell me where you should have avoided the signals.
– What according to you can help along with these oscillators.
– Can you come up with some other oscillator of your own which can measure some important thing )

JAIPRAKASH ASSOCIATES CHART

ok, So finally we end the 4th part of this series of articles on Technical Analysis. I hope you have learnt some things from me.

Earlier Posts

Part 1: What is Fundamental and Technical Analysis and which should be used When

Part 2 : How to use Support and Resistance to BUY and SELL ?

Part 3 : How to use Trendlines to find Support and Resistance ?

Understand that we are not learning how to trade, we are learning some trading tools which can be used by long term traders to make better Buy and Sell decisions .

Incase you want to trade stocks/futures/options just after learning from these 4 articles, I must tell you have you have not learned even 1% required for trading. 99% is still there to be learned and over all knowledge of markets, technical analysis blah blah is just 10%. 90% is Psychology, your attitude and your Discipline.

Trading is risky and not easy to do for long term.

Leave you comments / thoughts / suggestions / and answers to test question.

hey .. wait a min, did you vote on the poll upper right side, I have asked on what all topics do you want me to write. Please select topics from them, so that you also get to read your favorite thing some time 🙂 cheers …

How to use Trendlines to find Support and Resistance

Hi Readers

This is 3rd part of “How to become Better than average investor” Series. Read

Fundamental and Technical Analysis, What and When ?: Part 1
Using Support and Resistance: Part 2.

Let us today discuss how can we use Trendlines to use Support and resistance levels and make better Entry or Exits.

What is a TrendLine?

A trend line is a straight line that connects two or more price points and then extends into the future to act as a line of support or resistance. In the Uptrend , we join two low prices points and in Downtrend, we join two high prices and extend it further. Next time when prices approach them, it should probably act as a Support or resistance point.

Let us see one example of each of them.

Example of trend line while DOWNTREND


You can see in the chart how Two high prices were joined and the line acted as Strong Resistance in future, 3 times prices touched it and broke down again, These are good price area where either one can go Short (sell), or book their profits. You can see that now prices are again Approaching to this Resistance line, so once prices reach this point, it may provide a good opportunity to sell.

What will happen exactly, better not to predict and let the market decide?

Understand that we are not saying that prices have to necessarily touch the Resistance line and then go back down , the trend line only provides Resistance, it may again go back much before touching it .

Example of trend line UPTREND

Below if the 2 yrs chart of HIND LEVER, Let us try to make a trend line which acts as support.

If you see the chart, I have connected two low prices and extended it in future, you can clearly see how it acted as support area and prices went back up from there, At the end, you can see how prices are again approaching this support area, most probably this will again hold and it should be a good BUY 🙂

Let us see one more example of Trend lines. This example will show us the following things :

Resistance line using a trend line.
– Breakout
– How Resistance once is broken became Support
Resistance line using trendline for a shorter time frame.

Let us see a 2 yrs chart of JAIPRAKASH ASSOCIATES


You can see here how I joined two HIGH Points and extended the trendline in the future, and how prices reacted to this Resistance line. Recently Prices broke out of this resistance line and then this same resistance line acted as the Support line and prices bounced back from there.

Also, you can see a small trendline, which was made joining the low points . you can see how prices bounced up as this support line held the prices. So, we have seen some examples of Trend lines and how they can act as Resistance or Support lines (as per situation).

Some of the important points to note are :

– It’s more of an art to making a trendline, it depends on how you make them using HIGH PRICE, CLOSE PRICE, etc.

– You can make Trendline for any time frame.

– It’s not necessary for prices to touch trendlines, you should not expect it.

– It’s a wise decision to BUY OR SELL using trendlines. If the trade goes in your favor, let your profits run, if it fails, cut your losses short and accept it. there is no problem with being wrong . even the best in Industry fail.

Trendlines will be of no help unless you control your GREED in markets. Don’t put all your money in a single trade. Keep adequate cash for bad times.

– Once trendlines are broken, take it seriously, it has happened for a reason :).

– Make sure that the two points used to make the trendline are not very near, there should be some time gap between them to believe in them.

– More times the trendline is touched by the price stronger it becomes, And stronger is the break out from that trendline.


Test for you 🙂

Below is a chart, and I have drawn several trendlines in different time frames, I have marked some points with 1,2,3,4,5, please tell me what are each of them and comments on each point. please do it individually. Let me see who comments correctly on each of them. Also, tell me if there is any other trendline that could have been made, but I have left it?


People who are good with Videos can watch the following videos


Please comment on this article, did you like it? Was it easy to understand? Is it too difficult to use Trendlines ?

Conclusion :

So we end this Article here, We saw the Importance of Support and Resistance and how to make trendlines and use them. In the next part (last part), we will see how we can use some of the Indicators from technical Analysis to make the decision better.

Also, we can see that even by visual inspection we can get some idea about which area is support and resistance area.

For people interested in learning these things in detail, I would recommend the book “How to make money trading with Charts” by Ashwini Gujral.


Investment mistakes by retail Investors and how to avoid them

“People who take some pain eventually Gain”

Have you invested in the peak of bull run (Nov Dec 2007 or Jan 2008) or in middle of this downturn (Mid of 2008) and now sitting on heavy losses.

In this article we will discuss how and why should we avoid it. This article mainly covers investors who invest there money in some share for relatively short term like 6 months to 2 years, even though its applicable for all kind of investors.

investor mistake

Robert bought 100 shares of Jaiprakash Associates around May 2008, at Rs.300. His reason was simple, The stock has fallen “a lot”, “how low can it go? “, ” What if I don’t buy it and it goes up again, I will miss the profits”.

Does it sound similar?

Then stocks moves upto 350, and he is so furious that why he didn’t out more money. within some days stock comes down to 250. Now he feels that he probably made a mistake and made investments at right decision. He was sad that he is now in loss , he says to himself, that he will get out at cost once it moves up to 300.

Now it comes down to 200, He is not thinking why didn’t he get out at small loss? He is not ready to get out at 250, and he is determined to get out. But it never happens and stock tumbles down to 160, Now he tries to play a trick with market, and wants to prove his point that he is also smart.

He triples his shares by buying additional 200 shares by buying the share at 160 and averages his price to Rs.207, He can now get out once shares move to Rs.200 or 210 and he can get out at cost price or may be he can make some profits also.

But stocks still goes low and reaches low of 45-50. At the time of writing this article, the price for the share is around Rs.90. Probably it will take at least 1-2 yrs for this share to reach Rs.200 levels and that will happen once overall markets stabilizes.

Does all this sound similar to you?

What are the wrong decisions Robert made?

1. Trying to Time the Market :

The one reason was that he was trying to find out if share has made a low. He believes that share has lost a lot of value and will not go further.

Learning : There is an old saying, “Dont catch Falling Knives”, When a share has started its down move, the chances that it will move more down is more than its going up. The overall mood is bad. There is no MRP of shares, there is only market value. Prices are governed by emotions and sentiments, Don’t try to get in middle buying them. Rather short sell it or wait more.

2. Patience :

The other problem was no patience, Just imagine if this person had more patience, What if he waited for stock to go as low as possible and then start its journey upwards and then buy it. I am not saying, its a right time to buy, but current scenario provide much better risk/reward ratio.

Learning : Don’t go against the trend, if markets are falling like hell. don’t mess with it by buying in between. Have patience, No profits are better than losses I guess. Always try to be with the trend, A stock has more chances of going in the same direction of the trend rather than counter trend.

On the day Satyam bad news came in, I don’t know why people bought shares in between it was falling, It fell from 170 to 40-50, But people bought it in between around Rs 120 levels, thinking, “How low it can go”. Eventually some people bought it at 20-25 levels and many have doubled there money in weeks.

Patience helps.

3. No Stop loss or Targets set :

Often people emotions come in between there trading or investing. “If only it comes back to Rs XYZ I will get out”, Once it goes up by Rs PQR more, I will get out”.

People invest without knowing there risk capability, They don’t invest with some target, once your shares rises by 20% in 1 month, you may often think, what if it goes up to 50%, then I will miss out those profits.

They also don’t want to take losses, they only want profits, once prices go against them, they are not ready to get out at small loss. They want there money back. Then prices move a little more down and then this vicious circle of “If only it comes back to this point, I will get out” continues

Learning : Do you invest to be right or to make money. What is your goal? I guess its to make money. So don’t feel bad if you are wrong some times, it happens with everyone. The most important thing is to not let it become so big, that it becomes pain.

Have a stop loss, When you buy something at 300, say to your self that if it comes down to 250, I will take Rs.50 loss and accept I was wrong and move on to find out a new opportunity. And also tell yourself that if it moves to Rs 500, I will get out, take my “excellent profit” and then find out some thing else. Don’t be too greedy.

It hurts in long term. “just a little more” is a not a good idea.

You can read a similar article where I discussed 5 mistakes of my First trade.

Watch this video to know why no Retail Investors make money in the Stock Markets:

Conclusion :

The main idea of investing is to make money, don’t try to prove market that you were correct and no one can make you wrong, keep your emotions at home, If you are wrong, you are wrong, Just accept it, take small loss and try to find out new opportunity. Don’t waste time with the losing trade and give all your time and effort in that.

Know some rules and stick to it. Mainly this is applicable to traders whose time horizon is very less like day or a week, but this also applies to investors. Even if you are investing for long term like 10-20 yrs. Buying a share at low cost can have dramatic affect on your corpus. Just imagine this :

Ajay invests 1 lac in Unitech at Rs.150 just after it fell from 900 levels in Jan 2008. His investment after 30 yrs was 66 lacs.

But Robert waited patiently to let this share go as much down it can be and after markets shows some strength and signs of recovery bought it at Rs.30, His corpus would be Rs.3 crores.

Just imagine the difference of having some patience and respecting some ground rules of investing. It pays .. believe me.

Keep coming to the blog as in coming days I will post an article about how a common person can use basic technical analysis to make his investments more powerful and less risky.

Question for readers : What do you think Robert could have done better? Or How what are the other mistakes which I have not mentioned?

Please post your views/comments/questions. Make it interactive.
I hope you have read my article on : How to use your losses to reduce your taxes

That’s all for now.