Review of Stockezy.com , A Social Investing Community

Ever thought of a Social Investing community website in India . I am glad to review Stockezy.com today which has grown to a popular stock investing community in last couple of months in India . Stockezy.com is one of the best online places you can get education, stock tips , great links for other financial resources (mainly stock market related) . Let me point out main features of this website which you can use to increase your knowledge and also contribute . There are different sections in Stockezy , Below is a short description of each of them .

Stock Picks : You can stock picks from members on different stocks in indian stock market . With every stock pick there are important things like  target price , target date , Stop Loss . There are picks for Buy and Sell both .  Link

Opinions : This is a section where you are read opinions of different members on variety of topics from market outlook , stock movement , Short term view , Long term views about something . In short this is a place where you can get to know what a person feels about a topic . There are different categories for opinions so that its easy to find out some opinion . Link

Questions & Answers : You can consider this as a forum for questions and answers , If you have any question on some stock , market direction or any other similar thing , you can just post a question and anyone who wishes can reply to your question . You can see it as a thread which discusses some idea . Link

Portfolio Tracker : This is one of my favorites , this is a place where you can test your investing skills and buy and sell in real time, Its a great platform to test your abilities before you enter the market . You can get your statement which shows your Profit/loss and all the transactions summary in short . So if you are a new investor who is going to enter the market , its an ideal place to test out your strategies and skills . Link

Share Links : This is a very nice addition recently on Stockezy.com . You can view this as a twitter of Financial Markets . Different Financial blogger post links to variety of topics here with different categories . Even I post my personal Finance posts there .  Link

[ad#big-banner]

Other Features

  • You can subscribe to RSS feeds of any particular sub features like  Stock Picks | Opinions | Answers .
  • You can watch out different top traders for different Time frames like Top day trader , Top medium term Investors etc
  • Gives you a list of Most active investors and top pickers , which gives you a good idea of whom to listen and whom not .

Stockezy is a fast growing Investors community with close to 1 million page views a month , You can get lots of great bloggers like Nooresh Merani , Arun the Stock Guru and other famous bloggers.  If you wanted a platform to show your investing skills , Stockezy is the place you belong to . Register to Stockezy using This Link

Further Improvements

There are couple of things which can make its much better . they are

  1. An online  technical Analysis Software system which users can use if they wish . There are many investors who like to technically analyse a stock and hence its a much have .
  2. More data on Derivatives segment . there is lack of quality data on F&O segment , so it can add the segment for that .

How should you use Stockezy ?

There are different ways you can use Stockezy.com , if you are new to stock market and want to learn how to to trading , learn the basics, you should join it and start doing the mock trading and see your porformance over a period of time , there are so many great people with knowledge out there who can give you some wisdom , listen to them . Before that you would like to read my ebook on How a newcomer should start in Stock Market .

Comments, Have a look at it and tell me if you like it , Feel free to give your negative and positive feedback .

Disclaimer : I am part of Stockezy.com Bloggers Network

List of Best Debt Oriented Mutual Funds for 2009-2010

If you don’t like Equity because you have a lesser risk appetite and  still you want to make better returns , where do you invest ?

The answer is Debt Oriented Mutual funds , In this article we will see What are Debt Oriented Mutual funds , A list of Good mutual funds and what are the returns you should expect from them .

mutual funds

Have a look at List of Best Equity Diversified Mutual Funds. These funds are getting very popular these days as people are not ready to put their money in market for long term because of Market Uncertainty and decreased risk appetite after the recent fall in 2008-2009 .

Hence these Debt Oriented Mutual Funds have become very popular , Read This Article

What are Debt Oriented Mutual Funds ?

Debt Oriented Mutual Funds are those Mutual funds which Invest primarily in Debt products like Debentures , Certificates of deposits from Corporates , Govt Bonds etc , They put a small portion in Equity also (10-40% max) . These funds generally return in range of 10-20% in long term and the downside is limited in these Mutual funds as Debt Component is High.

Please note that even these Funds can give Negative Returns but that happens in Extreme fall downs or very bad times. You should not assume these will always give positive returns. Also You should also concentrate on Long term returns, Dont judge a Mutual fund by Its Short term Returns

Let us see some Stats which will give you more idea about these .

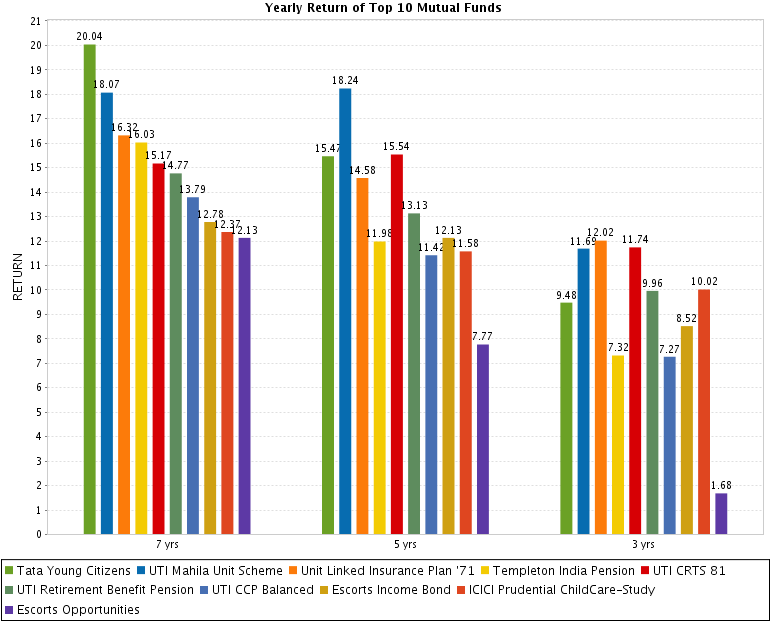
  • In 7 yr time frame Best return is 20%and worst return is 8.09% .
  • In 3 yr time frame Best return is 12.09% and Worst return is -5.87%  .
  • 5 funds are more than 10 yrs old .
  • Most of the Funds do not have an Entry load, but can have exit loads if exited before 2-3 yrs . Some have locking period also , but no tax benefit .

Below is the Chart I created which Shows CAGR return of Top 10 Debt Oriented Mutual Funds (Click to Enlarge)

List of Best Debt Oriented Mutual Funds

Source : ValueResearchOnline.com

List of Best Debt Oriented Mutual Funds

UTI Mahila Unit Scheme

  • 16%+ return Since Launch, 8 yrs old Fund , Excellent Track Record .
  • This is my Favorite Mutual Fund . Amazing one .. Read a complete review for this Mutual Fund Here

Tata Young Citizens

  • 14 yrs old Fund, Excellent Returns , This is extremely Risky Fund .. Don’t consider this as a Debt Oriented Fund
  • Equity Component is very high at 50% . So I am not sure if this will suit as Debt Oriented Fund .. only people with strong heart should take this .

UTI CRTS 81

  • One of the Best Funds , 28 yrs old fund , Lambi Race ka Ghoda , 13%+ return CAGR which is amazing for any debt oriented fund .
  • Equity Exposure of less than 30% and the worst return ever in 1 time period is -14% , the best is 35-40% in a year .

HDFC Multiple Yield Plan 2005

  • 4 yrs old fund , Extremely low Equity Exposure of less than 15% ,  Average return
  • Looks great for Future performance .

Other Good Funds

  1. Birla Sun Life Asset Allocation Conservative
  2. Templeton India Pension
  3. Unit Linked Insurance Plan ’71

Note : please make sure you read all the other details yourself before you decide on buying , These are just my personal opinion and make sure you are your own decision maker 😉 .

Last year when markets were doing bad , Debt Funds were the best choice of the Investors , However Its not the best time to Invest in pure Debt Funds , but rather invest in Debt Oriented Funds if you are not ready to take high risk.

Look at the following Video which Is not a recent one, but talks about How investors were eager to invest in Debt Funds Last year .

Conclusion

If you don’t have very high Risk Appetite , you can look for alternatives to Debt Oriented Mutual Funds , Its always better to park your funds with these if you want more than 10% return with some amount of Risk .

Please note that These are not equity Diversified funds and hence you should not expect very high returns from these .. If you get around 10-12% from these funds that is more than good . Anything more is wonderful .

Please share your comments. Do you think you will invest in these funds, Are the returns from these Mutual funds are worth looking at them? Any do you know of any other fund which is not covered here? Please leave your comments.

4 Charts which will change your perception about Equity

“Invest in Equity for Long term” You might have heard this sentence from me and others numerous number of times, but have you ever thought, why I say so? Or what is the logic behind that? What is the authenticity of what I say? Why should you believe me?

Hence, I came up with the most time consuming article of this blog till date. Lets explore the world of Equity today and I will show you some amazing numbers and graphs which will change your perception about Equity.

Equity

To make this article Crisp and short, I will show you 4 charts and explain each of them that will show you Power of Equity. Mainly the idea of this post is to show you the return potential of Equity in Different time frames and to find out what is the kind of return we should expect from equity in Long run like 15-20-25 yrs.

For the sake of calculations and source of reference, for almost all of the article I have used value of Sensex Index, but it should be almost similar for any Index Fund, ETF, or a Equity Diversified Mutual fund.

All the below study is based on historical 30 yrs of Sensex data from the year 1979.

1#Sensex Return Chart

Sensex has returns close to 18% CAGR in the long term till date for One time investment and SIP investment.


This chart shows you the CAGR (Compounded Annual Growth Rate) return of Equity after each passing Month. I have manually noted down the Index value for each month starting from Mar 1979 – Sept 2009 (total 350 months approx) and then did some number crunching (actually a lot) and came up with the CAGR returns the index has given for that time frame.

For example: for the month 36, the Index value was 218.82 and my starting Index value was 122.23 (Sensex actually started from 100, but I had a little late data). So the actual return was 23.16% for SIP investment and 20.78% return for one time investment.

So this chart shows that if you had Invested your money in the start and then hold it for a particular time frame then what will be your CAGR return till that point.

The chart shows the return for two kinds of Investment modes: SIP and One time investment. So Blue line shows the CAGR return if you did SIP investment and the RED one shows the CAGR return if you had invested in Start and sold after ‘n’ number of months.

View Data

Points to Note

  • In the Short term, returns have Wild Swings which is the basic nature of Equity
  • In the long run, returns were in the range to 18-23%, where it goes up and down because of Bull and Bear markets. See Nifty PE Analysis
  • SIP performed better than One time for starting 4-5 yrs and then SIP and One time investment were close enough.

2# Nifty Return Chart

Nifty has given returns close to 18% for SIP investment and close to 12% in 12 yrs from 1997-2009 .


This one is similar to the above chart just that it is for Nifty 12 yrs data. This chart shows you the CAGR return of Nifty after each passing Month. I noted down the Index value for each month starting from 1979 – 2009 (total 146 months approx) and came up with the CAGR return the index has returned up to that point.

For example: for month 120, the actual return was 23.33% for SIP investment and 13.17% return for One Time investment. So this chart shows that if you invested your money in the start and then hold it for that particular time frame then what will be your CAGR return till that point?

View Data

Points to Note

  • You can clearly see that the returns kept increasing with Tenure and there were less wild swings up and down with Returns.
  • SIP performed better than One time Investment in all the time frames. See that blue line was always higher than Red one for any given month.

Do you like the articles on this blog, Fill Fan book

3# Absolute Average Return for Each month (Sensex Data)

This shows you how much of absolute average return in percentage terms would you get if you hold your investment for X months.

This is an interesting Chart. It shows how much of absolute return can you expect when you hold your Equity investments for 1 month, 5 months, 50 months or 200 months. I will tell you how each duration is calculated.

Let’s say duration is 12 months, so what I did was that I took all the 12 months time periods like Apr 1979-Apr-1980, Mar 1979-Mar-1980, June-1979-June-1980 and like this the last 12 months time duration Sept-2008-Sept-2009, total of 113 different values, then calculated the Returns for each time frame and calculated the average of those 113 time frames.

I finally got average returns of 12 months Investment horizon (total 113 values for 1-13, 2-14, 3-15 month Index value). So I got a single value of 25.60% for 12 month time frame. This is absolute Return and not CAGR return.

So, if I invest 100, I get 125.60 as return.

Please make sure that you understand that this 25.60% is the simple average of 113 values, there might be many values which may be negative, 0, or may be 100%. But we are more interested in what is the average of all such values.

In the same way the Absolute Average return for 120 months was 672.60%, which means that 100 invested would have become 772.60 in 5 yrs. Please understand that we are just trying to show this as the time frame increase the return potential of equity goes up and up.

Don’t interpret it as the return guarantee for any time frame. It’s Equity, Respect it else it will punish you badly for your Ignorance.

View Data

Points to Note

  • In the long run, the average return has increased
  • For close to 15 yrs, the returns on Equity kept increasing but at a lower speed.
  • from 15 yrs to 29 yrs, the Absolute return increased very fast
  • So the real power of equity comes with long term.
jagoinvestor on Facebook

4# Number of Times the return from investment was Positive for some time Frame (Sensex Data)

This graph shows that how many times an investment has returned positive for some particular time frame, for example for 4 yrs time frame (48 months). There would be many 48 months time frame like Mar-1979-Mar-1983 OR Jan-1994-Jan-1998 or any other date, out of all those 48 month time period, the investment gave positive returns for 87.36% times.

So this graph shows how the number of times went up and up as the time duration was more and more.

For a particular time frame like 50 months, I calculated returns for all possible 50 month window and then saw how many number to times it gave positive return and then divided it with total number of times to get the percentage of times, the return was positive.

So if there were total of 200, “50-month” period and 180 times the return was positive. The result would be 90%. I did this same thing for every time duration from 1-300 months and plotted the graph.

View Data

Points to Note

  • One an average the chart was rising, which kind of proves that Risk of losing in Equity decreases as time duration increases.
  • After 11 yrs, there was no instance when equity return was negative, which means that you invest any time in Sensex index and take your money out after 11 yrs, you will not lose. The return would be positive always.
  • For smallest time frame of 1 month, the percentage was around 55%, which shows that for smaller time frame the equity returns are random like coin toss which is 50%-50% possibility. But as time horizon increases its more of power of Equity, rather than randomness.

Get Free updates on your Mobile

Conclusion

Many people are afraid of Equity because it can give negative returns, which is 100% true and possible, but people do not understand that its not a short term wealth building asset class. Its some thing for long term.

When you invest in Equity for Long term, you are bound to get excellent returns given that you have faith on Statistics, Historical performance and the concept of Equity in general. You can also maximize your investment performance by active participation in your investment and honoring Asset-allocation and portfolio re balancing from time to time.

Time spend and tools used to this article

You might have spent 20-30 min to read this article, but I spend close to 25-30 hours on

  • Finding data
  • Doing calculations
  • Making Computer program in Python: See the Python Code written by me for this article
  • Making Charts in Excel, See Chandoo.org for excellent Tips
  • Actually Writing this article

Comments Please, I would like to hear your views on this article and your views on Power of Equity. Is there something to be added? And Did this article succeed in changing your views about Equity or not?

Note : I will be on vacation now and will keep posting some articles whenever I get time .=”

Current Situation of Stock market , What should you do now ?

Markets are at their 15 months high. Retail investors are back and I am sure you must have got the left out feeling by now, as stock market have gained more than 100% in last 6 months.

What shall one do now, Shall we invest for long term now, Will markets go up or down. Trading is Probability and hence we shall take our decisions based on probability only. Lets see what are my views on current market conditions.

People who have just started in Stock market should have a look at my “How a beginner should start in Stock Market” Ebook.

Current Situation of Stock Markets

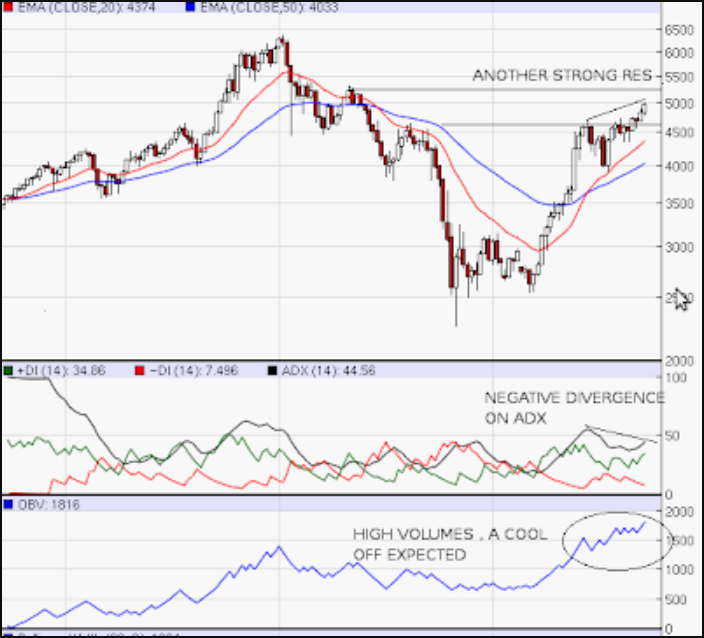
Markets have crossed important levels of 4850 before some days and have been stable there for some days .. Once it crosses 5300, which is another important level, I would be very much bullish then and will be willing to agree that markets can again see the all time high of 6000+ in another 1 yr.

See the chart below.

Source : icharts.in

Above is a 3 yrs weekly chart of Nifty. If you see the chart below you will see that another important resistance is at 5300 and you can also see some good negative divergence on ADX . This gives an indication that we must be cautious at the moment .. The upside might be limited to 5300, from where it can take a reverse turn.

But, As you must be knowing, markets are supreme and hence if it sustains that level. We will have to obey its order and remain bullish. You should have a look at Deepak Shenoy article on Nifty P/E and EPS growth some days back.

What about Nifty PE?

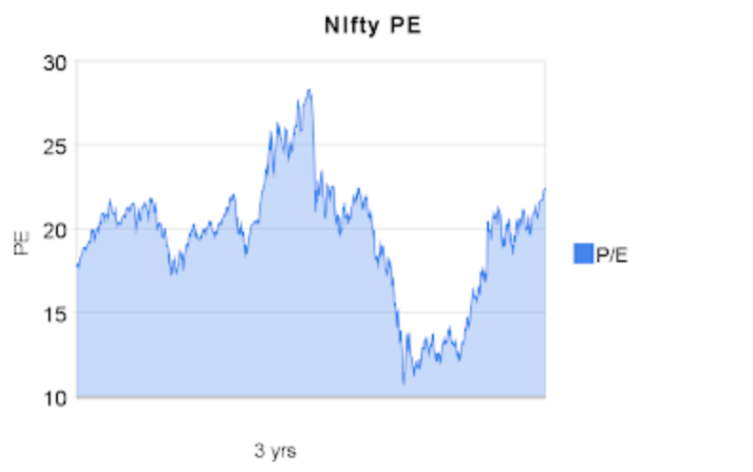
As of 21st sept 2009, current Nifty PE is at 22.40. Now this kind of number is not show very attractive valuation for long term. Below is the chart of nifty PE for last 3 yrs .. you can see how its has crossed important zone of 20+ and now heading to 25 which I personally consider as “SELL at any cost” level at the moment.

Nifty PE

Even though High nifty PE of 22 does not reflect great valuations, it can be used as short term indicator for catching some momentum move . So I would love to buy right now to get out at 10%-15% profit in another 1 month or so, or till market reverses heavily . But I would not like to make some long term commitments right now at this level, Better wait than never.

So what are the Possibilities

  • Markets can reverse now anytime before touching 5300 levels
  • Markets can sustain 5300 levels and then see 6000+ levels from where it will crash again

Conclusion

This post is just trying to see where we are and not trying to entice you to do trading, trading is a personal activity and can be done in many different ways. Where is will market go is a trivial question, the more important thing is “what will you do when market moves in any direction”

If you have any doubt you can leave your query in our comment section.

List of Best Equity Diversified Mutual Funds for 2009

Which is the best Equity Diversified Mutual Fund ? . I am going to list down some of the best Mutual funds which I have figured out from Valueresearchonline.com . I am listing down 6 Equity Diversified Mutual Funds and 3 Tax-saving Mutual funds . I will highlight the main points of Mutual funds like its History , its performance and its Portfolio Allocation.

Best Equity Diversified Funds

These funds are suitable for people who are looking for long term investments and are ready to take the risk of mutual funds .

DSPBR Equity-G

  • 12 year old fund , Return Since Launch is at an excellent : 24.6%
  • Strong 5 yrs return at 33.4% beating its benchmark by impressive 8.4%
  • 50% Portfolio in Small and Mid cap Companies (Risky Fund, with High Potential)

DSPBR Top 100 Eqt Reg-G

  • 6.5 year old fund , Return Since Launch is mind boggling : 36.8%
  • Strong 5 yrs return at 30.6% beating its benchmark by 6% .
  • 80% Portfolio in Large and Giant Companies
  • Looks less risky Fund compared to DSPBR Equity-G

HDFC Top 200

  • 13 year old fund , Return Since Launch is excellent : 25.3%
  • Strong 5 yrs return at 31.8% beating its benchmark by 7% .
  • 65% Portfolio in Large and Giant Companies and 30% in Mid caps . Well Diversified Fund
  • One of the best funds available with long term Track record . Must Have

Magnum Contra

  • 10 year old fund , Return Since Launch is excellent : 27.6%
  • Strong 5 yrs return at 35.86% beating its benchmark by astonishing 11% .
  • 55% Portfolio in Large and Giant Companies and 35% in Mid caps and Small cap .

Reliance Regular Savings Equity

  • 4 year old fund , Return Since Launch is 21% even with the bloody market Crash.
  • Strong 3 yrs return at 21.5% beating its benchmark by 12.5% speaks for its potential in Future .
  • 45% Portfolio in Mid caps and Small cap makes it a Risky and Aggressive Fund .
  • With minimum investment required of Rs 500 , It can find a small corner in one’s Portfolio
  • Only for Risky Investors , Its a new Fund and hence does not have Strong and Long track record like its seniors .

Sundaram BNP Paribas S.M.I.L.E. Reg

  • 4.5 year old fund , Return Since Launch is 22.5% even with the bad markets.
  • Good 3 yrs return at 16.5% beating its benchmark by 7% .
  • With close of 75% Portfolio in Midcaps and Small cap makes its Fund with heart of real Risk takers . Don’t get into this if you don’t like messy markets . It can take your heart our of your body and play hide and seek with it .

You should see this Video to understand how to choose a good mutual fund on your own

If you are fan of Jagoinvestor or Manish , you might like to Fill up the Fan Book

[ad#text-banner]

Best ELSS Mutual funds (Tax Saving Mutual Funds)

These are tax saving Funds , used for saving the tax under Sec 80C upto Rs 1 lac . Suitable for investors who want to invest for long term and also require tax saving .

Sundaram BNP Paribas Taxsaver

  • One of the oldest Tax saving Funds with 10 yrs of Strong Track Record
  • Return Since Launch is 22.3% .Strong 33% return in last 5 yrs beating its benchmark by impressive 6.5% .
  • Very good performance in last 2-3 years in falling markets with 17.3% return in last 3 yrs which is almost double of its benchmark returns .
  • Well diversified amoung Giant , Large and Midcap companies makes its a Good fund .
  • A little aggressive fund with 55% portfolio in just 3 sectors of Energy , Finance and Construction , betting on India’s future ..
  • A very flexible fund know for its adaptability with any situation makes it suitable for every kind of investor.

Canara Robeco Equity Tax Saver

  • One of the oldest Tax saving Funds with 16 yrs of Good Track Record
  • Return Since Launch is 15% which is decent enough in such a long term .
  • Very good performance in last 5 years with 30.5% return beating its benchmark by impressive 7% .
  • Mind Boggling 60% return in till date in current year (2009) shows that some great potential is building in this fund .
  • Well diversified amount Giant , Large and Midcap companies makes its a Good fund .
  • High Concentrating in midcaps (around 50%) makes it a risky Fund .
  • Minimum Investment of Rs 500 makes it an attractive choice for Risky Small Investors .

HDFC Tax Saver-G

  • This one is the quite genius who does not shout much about its achievement . Not much appreciated among its peers but has one of the best long term track record which has ability to put all the tax saving funds in shame .
  • One of the oldest Tax saving Funds with 13.5 yrs of excellent track record.
  • Return Since Launch is 34% which is an unmatched achievement in itself .
  • Close to 29.5% returns in last 5 yrs beating its benchmark by 6% .
  • It is now becoming more aggressive by increasing its allocation in Midcap funds .

Note : This is not an exhaustive list of Good funds . There are many good funds which are not here . Its just a Compilation of funds which I personally feel are good ones and have ability to perform in Future . All the funds have high Equity Allocation and can be very risky . You should invest in these only after understanding your Asset Allocation and Risk-appetite to handle the ups and downs of its performance .

I will come up with the compilation of some good Sectoral Funds , Debt Funds and Balanced Funds later . Watch for it 🙂

Comments Please and let me know which fund is your favorite and why . If I had to choose 1 fund , it would be Sundaram Tax Saver because I did a detailed Analysis of it myself and It went ahead of SBI magnum which had number 1 position from long time .

Source : ValueResearchOnline

Liked the post , Subscribe to Get Posts in Email or RSS Reader

New Mutual Funds Charges from ICICI

ICICIDirect has revised its brokerage charges for Mutual funds Investments . Some time back SEBI abolished mutual funds entry load , In this post we will see the new charges by ICICIDirect and analyse if its good or bad . The new revised charges look good to me . In case you don’t know what is SIP , Read here

So ICICI Direct came up with this Rule . If your Mutual Funds portfolio with them is

Your Mutual Funds Portfolio Above 8 Lacs with ICICI


So , it means you can just invest through ICICI Direct website and your brokerage would be Nil and you wont pay any thing in charges .

Your Mutual Funds Portfolio is Below 8 Lacs with ICICI


You will have to pay lower of Rs 30 or 1.5% of the amount each time if you go for SIP . On a lump sum investment , you will pay Rs 100 .

Is it Good or Bad ?

If your SIP payment is High

This revised charge structure will be very good for you if you are making Higher SIP payments like 10,000 . In that case your charges would be Rs 30 each time , which is 0.3% , which is 87% cheaper than earlier cost (2.25% entry load) . Even with 5,000 SIP , your charges would be .6% , which is much better than what you were paying earliar and this all with the convenience of doing everything online yourself .

Read why SIP is best for salaried class people

If your SIP payment is Small

If your SIP payments are less than 1,500 , then your charges would be 1.5% , which is near 2.25% , what you earlier paid, you are still benefiting , but not to great extent . Now its you who have to decide

  • if you would like to go with direct Mutual funds investing yourself (without any charge at all)
  • You can find some other agent who charges less than 1.5%
  • You are ok with 1.5% charges and comfort is more important to you .

Suggestion to people who have lot of Mutual funds in your portfolio

In case you have too much mutual funds in your portfolio and your SIP payment in each of them is small , the better thing would be to prune out most of them and consolidate your mutual fund portfolio to maximum 5 funds and better to more payment in each , for example if you have 15 mutual funds of Rs 1,000 each , change it to 4 mutual funds with 4k payment to each or Something like that . It will help in management of funds also and also help you reduce the charges .

There may be some other agent or web portal who are not charging at all for mutual fund investments through them . For people who are yet to open a Demat account and also looking for Mutual fund investments , Opening a ICICI Direct Demat account may be worth looking into .

What is most Important

Don’t try to put too much thinking in this , less charges are good , but its not the main thing , you must concentrate on your Asset Allocation and Portfolio Rebalancing and choosing a good mutual fund for you . So if you getting a good advice , its worth to pay good fees for that , don’t try to save that small amount just for saving it .

Please comment what do you think about this ? Do you know of some other alternative route through which the commission will be better than this .

Liked the post , Subscribe to Get Posts in Email or RSS Reader

What is Direct Tax Code and How does it impact common person

There is going to be some really big changes in Taxation laws if “Direct Tax Code” comes into existence year 2011. There are some big changes proposed in the Draft which if implemented will be the biggest ever change in Tax laws and will impact people in a big way.

Let us see what are the changes Proposed and How they will affect you?

direct tax code

What is Direct Tax code ?

The Finance Ministry has released a new draft direct tax code, which is a document containing changes in Exemptions, Tax slab. This will be a big change to four-decades old Income Tax Act . As per the proposal, the new tax slab would be

  • 0% : Less than 1.6 lacs
  • 10% : 1.6 – 10 Lacs
  • 20% : 10 – 25 Lacs
  • 30% : 25+ Lacs

This sounds really amazing that almost 90% of Indian (tax payers) will then pay 10% tax because majority of the income earned will be below 10 lacs (that’s very obvious). We will a comparison at the end. Don’t Worry 🙂

If you are a Fan of Jagoinvestor or Manish , you might want to fill up the Fan book

Other Major Changes which can affect a Common person

1. Tax Exemptions upto 3 Lacs

At present we get exemptions upto 1 lac under section 80C . This may be raised to 3 lacs . This will encourage people to invest and help.

2. Proposes tax on Maturity amount from Insurance Policies, PPF, EPF and GPF

This is a big turnoff. So as per the new draft, the amount you get on maturity from your PPF, EPF or Insurance policies will be taxable, just like NPS right now. As per the proposal, the amount accrued till 2011 will be non-taxable, this will be applicable to all the proceedings after 2011. So some relief here.

3. Interest you pay for housing loans cannot be exempted and your tax burden increases.

I know it can spill water on your plans to buy home, but that’s true. If new proposal becomes a law you will then be paying tax on that 1.5 lac which you could have saved. Business Pundit has a view that Removing the tax benefit on Home Loan Interest part is positive news and will impact positively . Read it

4. Recommends Long term capital gains tax to be reintroduced and Short Term Capital gain tax to be added in Income

Enough is Enough- is what you may be thinking. 🙂 But tax on long term capital gains may be introduced which means that you will have to pay some tax on that profit from Mutual funds or Shares which was tax-free after 1 yrs. Short term capital gains will be added in Income and taxed at applicable rate.

Also Short Term capital gains would be before 3 yrs and Long Term capital gain after 3 yrs. Long term Capital Gains will be less than regular tax slab, I think around 10% or 15%.

5. Suggested abolishing the Securities Transaction Tax (STT)

So the STT which was paid while buying shares will be abolished. Currently when you buy shares you pay a small tax called STT which is included in share cost by your Share broker, this will be no longer there 🙂

6. Perks now will be included as a part of the income for purpose of tax calculation, so tax burden may be sightly more.

All the perks you were getting from your employer like interest free loan, free lunch etc will get added to your income and be taxed.

7. Lowering Corporate tax to 25% from 30%

This will cheer up companies as their tax burden would reduce. I am not sure about its impact on common person.

Watch this video to know more about direct tax code:

Comparison of New Vs Old Tax Code

Lets see an Example
Name : Ajay Patel
Salary : 8 lacs per year
Investments : Investment of 30k in Mutual funds, 30k in EPF, 20k in PPF and 20k in Insurance Policy.
Home Loan : Taken a Home loan and pays 80k as Principle and 1.4 lacs as Interest.

Tax as per Current System

Amount Exempted = 1.4 lacs as home loan interest + 1 lac in 80C = 2.4 Lacs
Taxable Income = 5.6 lacs
Tax = 14k (10% from 1.6 to 3 lacs) + 40k (20% from 3 – 5 lacs) + 18k (30% on 5 – 5.6 lacs) = Rs.72,000

Tax as per New Tax Code

Amount Exempted = 1 lac from (mutual funds , PPF , EPF , Insurance) + 80k as Home loan principle = 1.8 lacs
Taxable Income = 6.2 lacs
Tax = Rs 44,000 (10% on 1.6 lacs – 6.2 lacs)

Note: Your Tax Liability will be totally different and can vary a lot depending on the your condition and financial commitments. Don’t take this one example personally as its just for demonstration purpose.

Is New Tax Code Good or Bad

This is an important and good question. I will classify this tax code as a good one the biggest thing to note in this is that the tax slab is just 10% for income from 1.6 lacs to 10 lacs. There are many changes in the new tax code which may look bad and hurting but at the end you will gain from it because the tax charged will be just 10%.

So your taxable salary will go up because of some changes but your tax liability will actually reduce. It will not reduce too much though but surely it will be a reason to cheer up.

The biggest doubt is that over long term if my Maturity amount from Mutual Funds, Insurance policies and PPF will become taxable?

Then YES! But now you will save more to invest. So, even if we assume 20% tax charged at the end, we need to invest 25% more than we usually do to gain that will happen I believe… Anyways, this is now a debate topic and can be argued upon.

Download the Full Direct Tax Code Bill 2009, Click Here

Conclusion

This was just an analysis of the proposed DTC and how the changes can impact if it is approved. But for now, its just a proposal so don’t panic. Lot of debates and discussion will happen on this and this can take totally new direction or may be it does not happen at all and we continue with current tax system.

Comments Please as I would like to hear your views on New Tax code and how can it impact you. Do you think its a right thing to do and what are the issues involved with it? Did you like it?

Liked the post , Subscribe to Get Posts in Email or RSS Reader

What is IRR and XIRR and how to Calculate it

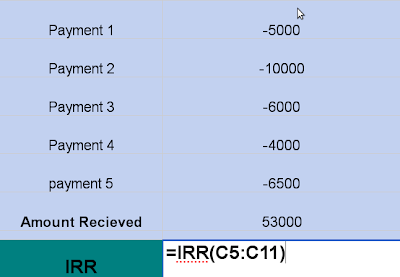
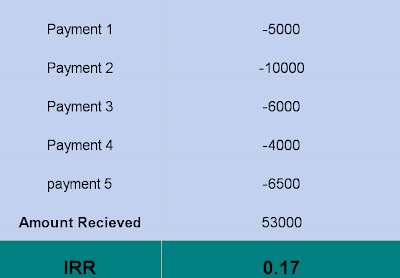
How do you calculate your returns when you every year you invest different amount and at the end you receive your Money back? Suppose your invest 5000, 10000, 6000, 4000 and 6500 in 5 yrs and Get 53,000 at the end of 5 yrs then what is your Return? It’s 17.4%. The concept is called IRR. Read below to understand more:

So Here we will learn two things IRR and XIRR

What is IRR and How to Calculate it?

IRR is Internal Rate of Return and it is used to calculate the returns given some amount at a fixed interval i.e. after every 3 months or after every 1 yr. The only thing which matters is that there should be equal distance between two installments. We will learn how to Calculate IRR in Excel Sheet. You would also love to read what is NPV ( Net Present Value) .

How to calculate?

  • Enter your Investments (amount which you paid) in each row (you have to put “-” before each value)
  • Enter the Amount you Received at the end (put “+” after that amount)
  • Formula: =IRR(values)( place your values put the range of cells which contains values)  see below:


[ad#big-banner]
Use this Spreadsheet to calculate IRR for yourself

Things to NOTE

  • The values need to be a set of Positive and Negative Values
  • The last value is the amount you receive
  • Any amount Invested will be Negative so if you invest Rs 10000, put -10000
  • Any amount you Receive will be Positive so if you get Rs 5000, put +5000
  • All the payment or receiving of money are equidistant, Like 1st of every month OR May 15th Every year
  • All the payments are assumed to be yearly by default. If its’ some other time frame like monthly or quarterly use XIRR and put specific dates.

In the above example, the CAGR return was 17%. See this video post to understand how to calculate CAGR .

What is XIRR and How to Calculate it?

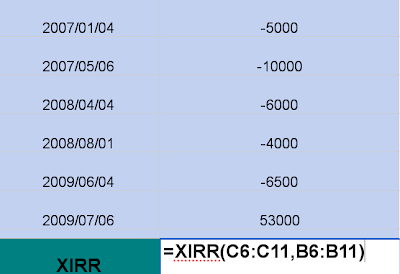
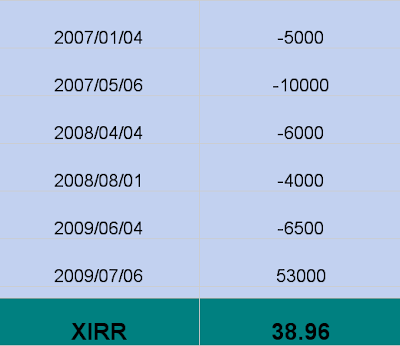
IRR does not solve one problem and that is when the payments are at Irregular interval. In that case we use XIRR. So in a Spreadsheet we put the date and the value both. See the example below:

How to Calculate

  • Put Date and Value for each row
  • At the last row put the Date and amount you received
  • Put the formula as: =XIRR(values, dates), values and dates are the cell ranges


Use this Spreadsheet to calculate XIRR for yourself

In the above example the CAGR Return was 38.96% (I have multiplied the return by 100 the actual value will be .3896)

Real Life scenario when you can use it

Scenario 1

Suppose you Invest in a Mutual Funds per month on your own , you invest on 15th of every month in year 2006

  • June 15 you invested 5000
  • July 15 you invested 6000
  • Aug 15 you invested 3000
  • Sep 15 you receive 5000 (dividend)
  • Oct 15 you invested 4000
  • Nov 15 you invested 12000
  • Dec 15 you Sell everything and Receive 35000

You can use IRR in this case and calculate your returns , the values you will be -5000 , -6000 , -3000 , +5000 , -4000 , +12000 , Calculate the IRR and put it as comments , lets see if you are correct or not ?

[ad#text-banner]

Scenario 2

You can also compare two business ideas using the XIRR , and decide which one is better then other . In any business concept you have to invest money and you get back some return , but these returns can be irregular and different amount every time , In that case you can use XIRR and compare the returns of both business and decide the one which has better XIRR

Note : the formula can give answers in a but different ways on Excel , OpenOffice spreadsheet , google docs or Zoho Spread sheet . Use this Spreadsheet to calculate IRR and XIRR for yourself . The spreadsheet is shared , so please dont make any changes other than “values” and “dates” .

Comments ? I would love to hear if these concepts are of use to you or can be of any help to you . is IRR a good way of measuring returns ?

Liked the post , Subscribe to Get Posts in Email or RSS Reader

ULIP charges restricted to 3% by IRDA

Does God Exist? I don’t know, but IRDA surely does!!! And hence finally it has acted as GOD to the investors 🙂 . On 22nd July, IRDA capped the ULIP charges at 3%.

Let us see in this article how this will affect Investors and the implications on Investments and Insurance Sector as a whole. The decision will be effective from Oct 1 2009.

ULIP

IRDA rules for ULIPS

Gross yield: This is the yield generated by the ULIP before all charges are deducted.
Net yield: This is the yield generated by the ULIP after all charges are deducted.

1. “ULIP charges” here would include allocation charge, administration charge, mortality charge and all such charges by any other name.

2. For Products whose Maturity is less than 10 years

  • “The difference between gross yield and net yield cannot exceed more than 300 basis points” (100 basis points = 1%)
  • “In this case, fund management charge cannot exceed 150 basis points”

3. For Products whose Maturity is more than 10 years

  • “The difference between gross yield and net yield cannot exceed more than 225 basis points” (100 basis points = 1%).
  • “In this case, fund management charge cannot exceed 125 basis points”

4. The IRDA has made PAN card mandatory for all policies where annual premium is more than Rs 1 lakh OR there is investment in Capital Markets. IRDA said this norm is to be implemented with immediate effect and all insurers are to comply not later than August 1.

What will be the Implications

  • ULIP products will surely see a decline in commission paid to agents. It’s very logical, IRDA is giving nightmares to Agents for some time. First it was abolistion on Entry load from mutual funds and now its capping the charges on ULIP. Agents are now going to get commissions which will be very very less compared to what they used to get earlier (like upto 35-40% in first year). It’s a bad month for Agents in India.
  • Now Agents would be really confused on whether to work hard on Selling Mutual Funds OR ULIPS as both are going to provide them almost the same kind of Commissions!
  • Miss-selling will be reduced in ULIPS as the primary motive of “High Commission” is crushed by IRDA.
  • Though ULIPs are still long term Products, I don’t recommend common man for short term investments in ULIP. Investors who think they are smarter than average investor can invest in ULIPs for short term, considering you know how to manage ULIPS well and reap the potential of switches (this mainly to churn the portfolio fast and save the short term capital gains tax). Read how to use losses to save your tax.
  • This Rule does not apply to traditional Policies, so its not a very good news for all considering Traditional Policies from LIC still dominate the Insurance Market :(.

What will happen to Existing Polices?

As per IRDA, all existing products that do not meet the requirements of this circular should be withdrawn or modified by December 31, 2009. I can only imagine the state of Agents and Insurance companies which created ULIP mess all these years. IRDA really nailed them hard this time.

Many agents which were getting fat commissions from so many months will be sad on this.

How much will this help Investors in reaping benefits from ULIPS

This is a good move from IRDA and investors will be benefited. But how much?

Earlier most of the ULIPS charged heavily in First and Second year and then reduced the charges to NIL or very very less in later years. Because of which the charges were heavily skewed in Initial Years, but the long term average charges were still in range of 3-5%.

Now after this new Rule from IRDA, almost all the ULIPS will charge for every financial year (that what i think). Hence the long term charges will now be evenly distributed over long term, but still the average charge over long term wont come down drastically!!

Read a nice article from Deepak Shenoy on “Tactics used by ULIPS to hide the charges”

Can you Invest in ULIPS now?

ULIPS for me has changed its status from “Ugly” to “Average” product after this announcement. For long term Investors, ULIPs can now serve as a good product.

Charges wise its much better in long term now ( 2.25% max) and the best thing is if you need immediate money and want to close the policy you will not be hit hard like earlier. Take the policy after Oct 1.

Some Internal Information

Just before writing this Article, I was chatting with Pradeep (name changed), an internal source who is himself an ULIP agent. See what he has to say

Guest_7FF767C0: attened a sales talk by XXX for their new ulip … XXX which guarantees highest nav for the next 10 years !!!!
Guest_7FF767C0: all ptvt. life companies are worried about mandatory PAN for annual premiums of rs one lac. and above.today smart money(black) is routed through ulip cash payments on binami names.

Guest_7FF767C0: but sir! IRDA may kindly look at the very very high incentives to the sales team(policy expences).sebi from aug 1 st declared no entry load for mutual funds so no early commissions to agents which is only 2.25% where as 40% plus in life!

So according to him, Due to the mandatory PAN for more than 1 lac premium. Lots of black money is coming through Benami Accounts now.

See The Benami Transactions (Prohibition) Act, 1988 High Net worth Clients do not want to share there investments with Govt to save tax, but because of the “mandatory PAN” rule, the money is being diverted through “Benami Accounts”. This is totally unethical and unprofessional, but this happens at the top ladder, Looks like IRDA still has some more work on this plate.

Conclusion

This move will help investors and it will check the mis-selling going on for last many years. It will also help in making Insurance sector more mature in India. IRDA is coming up with solutions now and Jagoinvestor sees this move as a friendly move which will help in achieving the goals of “Making each Indian an Informed Investor” Thanks IRDA.

Readers, what are your views on this Rule by IRDA, How do you think investors will take this ? And Is it helping you in any way. Please leave your Comments on this .

Liked the post , Subscribe to Get Posts in Email or RSS Reader

Understanding the art of Asset Allocation and Portfolio Rebalancing

What is better? Equity or Equity + Debt In this article I will show you how always maintaining your Asset Allocation with Discipline helps you in long term.

We will see examples of Asset Allocation with Portfolio Rebalancing with Charts and a small Presentation. At the end we will conclude that Having A small part of Debt in your portfolio is better than having no debt.

Note: Make sure you read this article in one go, not in parts.

Data Collection and Making the Case Study

I gathered the NAV of SBI magnum Taxgain ELSS fund (click here to see which is the better fund that SBI Magnum) for last 10 yrs for each quarter. NAV are for 1 Jan 2000, 1 Apr 2000 and so on for each quarter (getting them each one by one from moneycontrol was really time consuming). So we have 38 NAV values from Jan 1 2000 to July 1 2009.

Scenario

  • Total Capital Invested : 1,00,000
  • Debt Return : 8% per/year , 2% per quarter (for simplicity) .
  • Equity Return : Calculated for per quarter (if Nav rose from 10 to 12 , return was 20%) .

Now I am comparing Two cases with and Without Asset Allocation and Portfolio Rebalancing .

Case 1 : Money was Invested One time in Equity and then it was left for Growing.
Case 2 : Money was Invested and Principles of Asset Allocation and Rebalancing was also used.

We are trying to Study which one of Case 1 and Case 2 is better. I did a Small Study and calculated the returns on different values of Asset Allocation like 20:80, 50:50 and 80:20 etc. Here are the findings:

Let us first look at the chart with Asset Allocation 80% Equity and 20% Debt which personally suits me and almost anyone in below 35 yrs age. (click to enlarge)
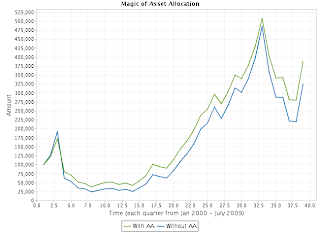

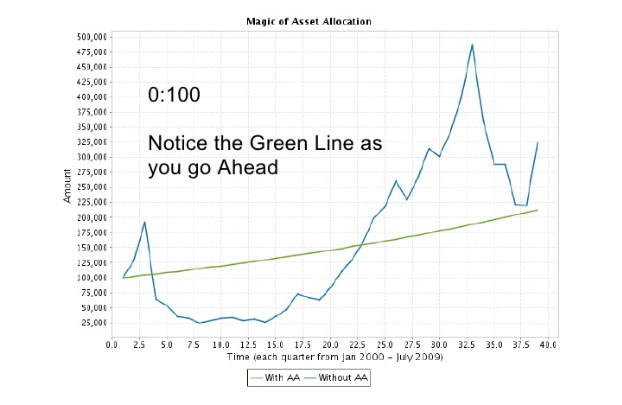
The Green Line is growth of investments with Asset allocation and Re-balancing (case 2), and Blue line is Growth of investments with no asset allocation (just equity, case 1). See how After 2 quarters, the Green line always was above Blue Line. Also see that final Value of Investments was higher in case 2 than case 1.

Also see, Magic of SIP , why SIP in mutual funds is best for long term.

The final Value of Investment kept increasing when Equity Allocation was raised from 0 to 70-80 and then started reducing when further increased it above 80.

See the Graph Below, this is a small presentation with each slide of separate Equity Allocation starting at 0% in equity and then increase by 10% every time. So first slide is 0% equity 100% debt, second slide is 10% equity and 90% debt and so on, it goes up to 100% equity and 0% debt.

It beautifully demonstrates the shift and change in value of Investment caused by Equity Allocation. To view it in the best way just have a look at each slide in one go and it will appear as a small video ;). Guys I worked hard on this.

Asset Allocation Effect (make fullscreen if you want)
Asset Allocation Effect

View more documents from manish.pucsd.

In a time span of 38 quarters (10 yrs approx), Case 2 consistently outperformed Case 1 i.e. if you see, in how many quarters Value of Investment was higher in Case 2 compared to Case 1, Case 2 beats case 1.

Below is the chart which shows in how many quarters Value of Investment was higher in Case 2 than case 1 i.e. for each quarter the case (case 1 or case 2) which has higher value of investment will get 1 point. You should also look at IV Ratio.

It was found that Case 2 always had higher points than Case 1 and Case 2 points kept increasing with higher Equity Allocation. The minimum Case 2 had was 19 points, when the asset allocation was 0% equity and 100% Debt. See the chart Below


Returns Were going up with higher Equity Allocation (around 70-80) and then fell further.

The final value of Investment was increasing for higher Equity Exposure till it was 80:20, and then it started Decreasing. See the chart below (click to enlarge)


To go deeper, I calculated some other returns.

Case 1 (Only Equity) returned

  • 13.2% CAGR in 9.5 yrs, see this video to learn how to calculate CAGR and other important formula’s
  • Value of 1,00,000 became 3,24,946 .

Case 2(Asset Allocation) returned

  • 13.1 % with 30:70
  • 15.11 % with 50:50
  • 15.67 with 70:30

In case you are new to Stock Markets, Download this Ebook on “How a Newcomer should Start in Stock Markets”, check out the Download Page for more.

What Does This Teach us

There are some important Learning’s here which we must understand well and have it deep rooted within us for our entire Life. This will help us in long term. Following are the Learning’s:

Learning 1# Equity Returns 12-15% over long term:

We can expect better returns from Equity in Long term, also average return over long term from Equity is around 12-15% as we saw in our case. So don’t expect returns like 30% or 40% every year. Once in a while you can get it but if you try harder and harder for it you tend to take unnecessary risk and hence screw yourself.

So better follow a disciplined approach and peacefully get 12-15% over long term. This does not apply to Traders and whole time participants in Stock Markets. They can/should/deserve to make more than 25-30% a year from stock markets.

Learning 2# Debt is extremely Important!!

Debt is an Important and vital component of Financial planning and your Investments. Love equity, Adore Equity and Worship Equity, but *don’t* forget Debt. Debt has eternal powers!!

Equity Combined with Debt can produce far superior returns over long term. In our examples above the best returns we got were for Equity and Debt ratio of 70-30 or 80-20 range.

Learning 3# Have a long term view to get results:

People who have recently started investing through SIP, ULIP or Direct Stock Investing need to understand that it takes time for the investment to grow!!

If you are doing right things like following specific Asset Allocation, Portfolio Re-balancing, Diversification, Investing with Discipline and control over yourself to avoid making stupid mistakes you need not worry at all. At the end you are the winner for sure. It will take time but things will show up.

You might see some person making 30% this or other year minting money from markets or from other investments and this can make you feel that you are left out but don’t feel bad, what you forget is that the other person is also exposed to extra risk which will kill him someday while you will be safe.

Learning 4# Returns is not Everything in Investments (my Favorite)

This is very important and you need to get this into your head and heart. Just like Money is not everything in life and there are other things like love, good health, Nature etc. etc. The same way in your financial life, you should have peace of mind. For which your investments value variation should not be wild enough to drive you crazy.

You should “aim for” and get “stable and good” returns which meet your financial goals, that’s it. Anything more than that will be a “treat” for you and should come to you without compromising your Needs in Life.

Suppose your money invested gives you return of 30%, -20%, 50%, -40%…. With these kinds of unstable and wild returns what will happen to your state of mind?

It will always be worrying over it and you will make mistakes in your financial decisions.

On the other hand if you get returns like 12%, -5%, 9%, 20%, -10% etc. It will not bother you much because there are no wild swings in your Investments value. At the end both will give you same kind of returns. The average returns would be same but the former case has higher variance of returns which “may be” good for your account, but it’s “not good” for your Mind and soul.

You will also notice in the charts above that with 70:30 equity : debt allocation, in 36 out of 38 quarters, the investments in case 2 were more than investments in case 1 which means that 95% it outperformed.

Learning 5# You should Start Early In Life

Ramit Sethi writes an excellent article on Why NOW is the best time for you to do anything , Be it early Investingg, Travelling, Meeting new people, whatever!! If you start early, you give enough time to your investments to grow and work for you. It also less risky if you start early because then the volatility is erased out in many years.

Partha shares a link for a study done on Similar subject at Accretus Solutions, Looks great link to me :).

** What do you think about This article, please leave your comment and suggest how did you like this article and what are your suggestions on making the investments in a much better way.

With this I will end this article, and dedicate this article to all the readers of this blog. I was working on this article for last 2-3 days, gathering data, doing calculations, creating charts, writing this article etc. etc.

It has come from hard work for some days, but the motivation behind it is my wonderful readers. Believe me or not, The person who has/will learned most from this article is ME, Thanks to you all – Manish

Liked the post, Subscribe here to get posts in email