How EMI’s Principle and Interest breakup is done

Do you know who to calculate principle and interest part in your home loan’s EMI break up? Do you know how each EMI is distributed to principal and interest repayments? It is extremely important to have this knowledge because a lot of real life decisions like prepaying the loan, opting for the loan tenure and many more such aspects depend on how your EMI is structured.

home loan EMI breakup

Basics of Home Loan EMI’s

What happens in a general scenario? Loan is opted for from a Bank and you start paying your EMIs each month as contracted (see this excellent article on how EMI formula is derived). When you pay your EMIs, some part of it goes towards interest and remaining towards principal repayment. So each month you are reducing your loan by some extent and now as your loan have reduced, you will be paying less interest on your next instalment. In the same way, with each passing month, your loan gets paid by some amount and balancing amount keeps on reducing resulting in paying lesser interest month on month and year on year and the day comes when you fully close your loan. Note that your EMI is generally fixed and internally it’s worked out into ‘interest’ and ‘principal’ repayments.

However, even today, a lot of people have no understanding of the idea that in the early years of repaying the loan, interest component is very high as compared to principal repayment. The longer the tenure of the loan, the interest component will be higher than principal payments and also the rate at which the interest part will come down will also be lower, making sure that in the initial years most of the EMIs goes towards ‘Interest’ and not ‘principal’.

Example of EMI payment

Lets say you take a HDC Home Loan of Rs 30 lacs for 20 yrs tenure, your EMI would be Rs 28,950/month. In the first EMI, the interest part would be Rs 25,000 and only Rs 3,950 will be the principal payment, which means out of total hdfc home loan of 30 lacs, only Rs 3,950 will be reduced in the first month and rest Rs 25,000 will go away in interest. Sounds disappointing? What is EMI disease ?

In the same way After 100 payments (8 yrs and 4 months), when you would be paying your 101st EMI of Rs 28,950, the interest part would still be as high as Rs 19,891 and the principal part would be Rs 9,060. Still disappointed? Now let’s fast forward towards the end, let’s take 200th payment. When you make your 200th EMI payment of Rs 28,950; this time your interest part would be very less at Rs 8,349 and principal would be Rs 20,601. So now, with all these examples I gave, you can see how interest part is very high in initial years. Let’s look at it from a different point now!

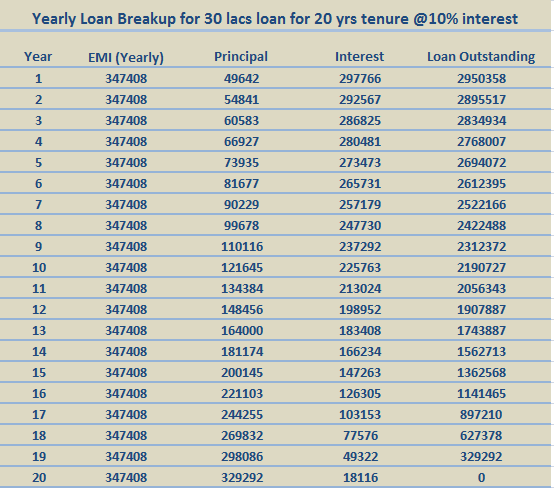
Just consider this- For the scenario above; If you keep paying your EMI’s for 2 yrs (24 payments), you will pay total of 6.94 lacs (24 x EMI) from your pocket, but your loan would just go down by 1.05 lacs! And your outstanding loan would be still 28.95 lacs. In the same way in 5 yrs even though you pay around 17.37 lacs (60 x EMI), your loan outstanding would be down by just 3.06 lacs and loan outstanding would be just Rs 26.94 lacs.

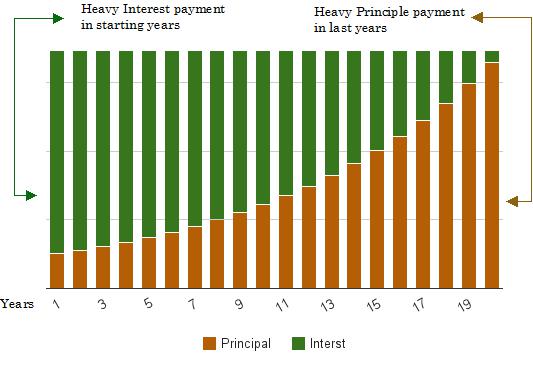
The chart below shows the breakup of interest and principal payment for each year for a 30 lacs loan for 20 yrs tenure assuming interest @10%. So each bar is broken into two parts, where green bar represents Interest part and orange bar represents principal part. It is clearly visible that how interest forms a major part of overall EMI in initial years and only in the later years principal part becomes high.
Loan Amortization calculation

Here is the actual breakup of the EMI in numbers
Loan Amortization

Pre-payment of long tenure loan

A lot of investors opt for 15-20 yrs loan thinking that they will pre-pay the loan in next 4-6 yrs itself because of their salaries will rise or for some other reasons. In these cases, for the initial years they keep paying loan interest only and not a lot towards principal. When they prepay the loan, they end up paying a little lesser amount then original loan amount. Example, if you take a loan of 30 lacs for 20 yrs tenure at 10% p.a. and prepay the loan in 5 yrs itself, you will still end up paying 27 lacs as loan outstanding, even though you have already paid 17 lacs in EMI in last 5 yrs, Pre-payment penalty would be extra! But the positive side is that there might be a good appreciation in the house value itself.

So if you are taking loan for longer duration thinking that you would pre-pay the loan very soon, you need to rethink! This makes sense, once the worth of your house has gone up and there is a decent profit. A better option which I can think of is to pre-pay in small chunks each year along with your EMI’s from the start of the loan payment. It would make sure that you principal goes down in big chunks each month.

If you take short term loans, because of the shorter duration, the bigger chunk of the EMI is actually principal part, hence you can look forward to pre-pay the loan incase you wish to.

Free Calculators for Loan Amortization

I have created and found out some loan amortization calculators which you can use for calculating your EMI’s and its breakup into principal and interest for each month.


By now you must have got a clear understanding on loan amotization and how home loan EMI is broken into principle and interest component. Note that the asssumption for this article was that the loan is on “Monthly Reducing Balance”
Auto Sweep Account – Enable it in your Saving Bank Account

Do you have a Bank Account? Off-course you do! How much money do you have in your account? 5,000? 20,000? or a few lacs? If you have a lot of cash, lying idle in your Bank Account, and at the same time you don’t want to commit to long-term investment, you need to enable the Auto-Sweep facility in your Savings Bank account. This will make sure you earn good interest on a major part on the cash lying in your Savings account.

Auto Sweep Bank account

What is Auto-Sweep Account ?

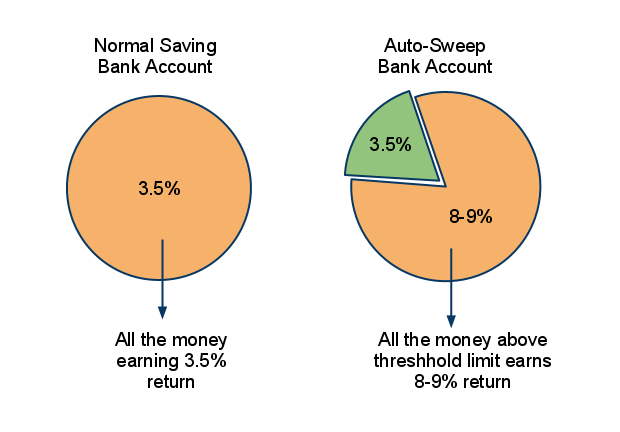
“Auto Sweep” is a facility which provides, the combined benefits of a Savings Bank account and Fixed Deposits. Auto-Sweep facility interlinks your saving bank account with a Deposit account and makes sure any extra amount lying in your bank account above a threshold limit is automatically transferred to Fixed deposits and you earn better interest on your money.

How ‘Auto Sweep’ works?

This is how Auto-Sweep works. You define a “threshold limit”, and money up to that limit will be in the form of cash in your savings account and any amount above this, “limit” will automatically be converted into a Fixed Deposit and you will start earning normal FD returns on that part of the money. At any point in time, if you need money more than is lying in your bank account, the money lying in the Fixed Deposits is Reversed-sweeped into your savings account and you can withdraw the amount you wish.

Example

Ajay opens a new Savings Bank account with SBI. He enables Auto-Sweep facility on his savings bank account and defines the threshold limit of Rs 30,000 . Now suppose he has Rs 10,000 lying in the bank, He will be earning normal 3-3.5% interest on this money. After that if he deposits Rs 60,000 in his account, his total balance would be 70,000. But as this is above his “threshold limit”, the extra amount of 40,000 will be converted into a fixed deposit automatically and start earning returns equal to normal Fixed deposits with SBI (for example 8%). This way he always has 30,000 in his account for his daily requirements, and he has 40,000 converted into Fixed deposits which again is available to him incase he requires it.

Now suppose he has to withdraw 10,000 from his account, he will actually withdraw it from the cash lying in saving bank , and his balance will reduce to 20,000. However on the other hand if he wants to withdraw Rs 50,000 . then in that case, as his account balance will be just 30,000, an additional Rs 20,000 will be auto-reversed from his Fixed Deposit and he can withdraw total 50,000 .

Opportunity cost

A lot of us don’t bother about how much idle money is lying in our account and for how long. This happens because we think “I might need it soon, so lets not commit to any investment.” But then, the money keeps lying in the bank for months and months and sometimes even years.

Suppose your account has Rs 1 lac for 1 year, it will earn 3.5% interest on it, which is Rs 3,500 for a year. However if you have auto-sweep enabled in your savings account with threshold limit of Rs 20,000, the additional 80,000 will actually be in form of a fixed deposit and it will earn an interest of 8% (assumption). In this, you will earn 3.5% of 20,000 which turns out to be Rs 700 and 8% of 80,000 which is Rs 6,400 , a total of 7,100 , which is almost 100% more than the first case .

A lot of people have much more than 1 lac in their accounts, not just 1 lac. You can earn some extra returns if you just enable auto-sweep on your saving account . So find out if your bank provides the facility, just do it, and get it right away!

Also note that different banks have different names for this facility. For eg., ICICI Bank calls it ”Auto Sweep” , HDFC Bank calls it “Sweep-In” account , and SBI calls it “Saving Plus.” . Here is a list of other banks and the name by which they call this Auto-Sweep facility (thanks for Gopal Gidwani for the info)

  • IDBI Bank – Sweep-in Savings Account
  • Axis Bank – Encash 24
  • Union Bank – Union Flexi Deposit
  • HDFC Bank – Super Saver Facility
  • Bank of India – BOI Savings Plus Scheme
  • Oriental Bank of Commerce – Flexi Fixed Deposit Scheme
  • State Bank of India – Multi Option Deposit Scheme
  • Allahabad Bank – Flexi-fix Deposit
  • Bank of Maharashtra – Mixie Deposit Scheme
  • Corporation Bank – Money Flex
  • United Bank of India – United Bonanza Savings Scheme

Disadvantages of Auto-Sweep Account

Auto-Sweep has some disadvantages too. In general the interest rates of normal fixed deposit and FDs under Auto-Sweep are same, but some banks charge a penalty if the FD under auto-sweep accounts are broken before some duration like 1 yr and 1 day . But I think that’s fine.  If not 8% , you will at least get 7%, still better than 3.5% .

Some banks are also known to give simple interest on the Auto-sweep Fixed Deposits and not compound interest as in case of normal fixed deposits .

Don’t over do it

While Auto-sweep is a wonderful thing for salaried class people who want to maintain liquidity, as well as want to earn more interest on their unused money, one should not over do it. If you are very sure that the money lying in your account will really not be used for long, better to use the normal Fixed deposit or Debt funds. Only if you are unsure of your money lying in bank and when you might need it, you should be using Auto-Sweep facility.

The way auto-sweep works, it makes it an ideal place to park emergency funds . So if you have kept 6 months of expenses as your emergency fund in Saving Bank, then you can enable auto-sweep facility and set threshold limit as 2-3 months of expenses, so that rest of the money can earn a better interest.

Comments: Did you know about Auto sweep account earlier? Do you think it will be helpful for you and do you plan to enable it?

How Interest rate and Bond prices are related ?

Bond prices go up when interest rates go down! . Have you ever heard that and wondered how is it possible ? What goes behind the scene which makes it happen? It’s important for you to know this, because now a days there are enough financial products which depend on interest rates, for example Debt funds, Fixed Maturity Plans, Infrastructure Bonds and many products. In this article I will show you in simple language how bonds prices and interest rates are related.

Interst rates and Bonds prices relationship

How interest rate and bonds prices are related ?

You must have heard or read often that when Interest rates fall, bond prices go up and when interest rates rise, bond prices go down. Also in many articles you would have read a term “Interest rate Risk”, but always wondered why its is a “risk”.

Let me give you a simple example . Suppose in the market the interest rates are around 10% , Now Ajay lends Rs 1,000 to Robert for 1 yr at the interest rate of 10% , which means Ajay will get Rs 100 as interest next year plus his initial 1,000 of principle , so Ajay will get back total Rs 1,100 at the end of 1 yr. Now suppose they sign a paper where all these terms and conditions are written and we call this paper as “BOND” . Who ever has this bond at the end can go to Robert and get Rs 1,100 by giving them that BOND paper. Now imagine two situations where interest rates move up and down and a third person called Chetan wants to buy the bonds after interest rates has moved. Lets see how bond prices move in both the cases here.

Case 1 : Interest rates go down

Suppose interest rates in market falls to 9% because of government policies or some other reasons (in our country RBI keeps change interest rates).

Which means now if a person lends Rs 1,000 to some one, he can get only 9% as interest. But Ajay has a special bond! , which actually gives 10% return (also called as coupon rate) and not 9%.  He is getting 1% more than what a new bond in market will give. Now if Chetan comes to Ajay and wants to buy this Bond from Ajay, Will Ajay give this bond at 1,000 ? No , This bond is worth more now, because this bond is giving more than what a normal bond in market can provide. What will be price Ajay can charge from Chetan ? It’s very simple maths.

If Chetan goes to market and invests 1,000 , He will get 1,090 at the end of the year because interest rates are at 9% only. So how much should Chetan pay for the bond Ajay is holding as he will get Rs 1,100 with that bond. It’s a simple calculation

=> To get 1,090 at maturity , Chetan has to pay 1,000 in current condition. so ..

=> To get Rs 1 at maturity, Chetan has to pay 1,000/1,090 in current condition.

=> To get Rs 1,110 at maturity, Chetan has to pay 1,100 * 1,000/1,090 today = Rs 1,009.2 (approx).

Which means as Ajay bond is giving 1,100 at the end , Its worth 1009.2 because interest rates moved down ! . So Ajay’s bond commands a premium of Rs 9.2 . You can see that 9% of 1,009.2 is equal to 90.8 and 1009.2 + 90.8 = Rs 1,100 which completes the equation .

Case 2 : Interest rates go up

In the same manner suppose interest rates move up to 12% in market from initial 10% . Now if a person lends Rs 1,000 to someone , he can get 1,120 at the end . Now Ajay’s bond is actually giving less than the new bonds in market . Why will some one pay 1,000 to Ajay to get 1,100 at the maturity , when they can lend the same money in market to get 1,120 at maturity , which is Rs 20 more .

So now if a person has to buy Ajay’s bond they will pay a less price (discount) . Using the same process you saw above you can find out that the new value of bond will be 982.2

=> To get 1,120 at maturity , Chetan has to pay 1,000 in current condition. so ..

=> To get Rs 1 at maturity, Chetan has to pay 1,000/1,120 in current condition.

=> To get Rs 1,110 at maturity, Chetan has to pay 1,100 * 1,000/1,120 today = Rs 982.2 (approx).

Now both the examples I showed you was a very simple example, considering maturity after 1 yr. It was just to give you a brief idea about how interest rates and bond prices are interconnected. However in reality bond pricing is much more complex as maturity can be much more than 1 yr. It can be 5 yrs or 10-15 yrs (SBI bonds). In that case finding a new bond price become a little complex . However the overall funda remains the same . You see what are the future cash payments you can expect from the bond and relate it to the current interest rates and find out the Net present value of the bond in today’s term. We will not go into how the complex formula is arrived at , but I am giving you the formula below which you can use incase you want some time.

Here is the formula which you can use directly for Bonds New price after change in interest rate .

Interest rates and Bonds price change formula

Where

P = New Bond Price

C = Yearly Interest received from the Bond

i = New Interest rate

N = Number of years for bond to mature

M = Maturity value of Bond (generally its same as face value of Bond)

Real Life Example

Recently SBI came up with their Bonds issue. Lets say you invested Rs 1,00,000 in those bonds with maturity of 15 yrs and you are getting 9.95% interest on it and lets say that after 3 months SBI again comes up with another bond issue but this time they are giving interest of only 9% on those bonds. In this case your bonds will become more valuable now as your bonds give more interest that whats going on currently in the market . So now if you want to see your bonds on stock exchange it will quote a higher price which is P in the formula above and lets calculate it. Also lets see what are different variables in this case as per the formula above .

P = This what we have to find .

C = 9950 (9.95% of 1,00,000)

i = 9% (new interest rate)

N = 15

M = 1,00,000 (value you get at the end in maturity)

Now if we use the formula above we will get

P = 9950 * {( 1 + 1.09^15)/.09 } + {1,00,000 / (1.09^15) }

P = 1,07,657.7

Which means you will fetch 7.6% premium in market because of decrease in interest rates . Now you find what will be bond price if the next SBI issue comes with 11% interest ? Tell me in comment section . The example I gave you is based on the formula only and small details are not taken care of which can further affect bond prices in market.

Note that in your life, you make many investments where interest rates come into picture but it’s behind the scenes . I will talk about some of those here .

Infrastructure bonds and other Bonds

You know that we have infrastructure bonds offered in markets , Weather tax-saving or non-tax saving , most of those bonds are going to be traded on stock exchange, so if you bought any of those bonds  in future when interest rates fluctuate , you know 2 things , what is the current interest rates and what is the final maturity value , using just 2 of these factors you can discover what is the current worth of those bonds and incase you want to buy/sell those bonds in stock market , you can command the right price .

Fixed Maturity Plans and other Debt funds

When you invest in Debt funds or Fixed Maturity plans , you give money to mutual funds and the fund manager uses this money to invest in bonds issued by Companies, government and other bodies . Based on the interest rates fluctuations in market they fetch good or poor returns based on their judgement . You as an investor would have more clarity about whats going on behind the scene . Just don’t be an ignorant investor who does not know how things work .

What you should learn from this ?

This article shows you how an investment can become attractive or unattractive based on interest rates, so incase you are planning to buy anything which depends on interest rates , better look at interest rates and study a bit on how it can move in future . If you are planning to buy some bonds today and there is anticipation in markets that interest rates are going to be raised at some time in near future , Your investments today in those bonds will go down in value because interest rates have moved up . At the same time if you feel interest rates will move down , It’s the time to buy those bonds !

This simple information is used by companies and govt to issue bonds , in the recent issue of SBI bonds even though SBI is giving 9.95% interest , if after 5th year they feel that interest rates can move down , they have kept their options open to kick you out of bonds and close the contract. Where as if the interest rates move higher , you can’t do nothing but you are stuck in those bonds for all 10 yrs , unless you choose you get rid of it by selling it on stock markets .

Share your comments about this and don’t forget to forward this article to any of your friends who were always confused about interest rates and bond price relation 🙂 .

Calculate returns from your Insurance Policies [Video]

How many times have you come across a situation when you wanted to know the returns from your Policies , It can be Endowment Plans, Money-back plans, Pension plans or a ULIP plan . You might be some money going out of your pocket in some years and money might be coming in your pocket in some years, which would eventually translate to some return overall . In this video tutorial, we will see how you can use MS Excel and use a tool called IRR (Internal Rate of Return) to find out the returns from your policies.

When can you use IRR?

Actually, IRR is a tool which you can use in any kind of situation where you are paying some premium across some fixed time frame, like per year or per month or any period with equal gaps! , not random payments with unequal gaps.

For the sake of simplicity, I have taken the case of yearly payment in this article. In the above video, I have covered 4 types of situations, like See More Financial Calculators

  • Endowment plans with maturity amount
  • Moneyback plans with money coming back to you in between
  • Pension Plans
  • ULIP Plan

Important Points

  1. There will be years when money goes out of our pocket, we have to put negative value. For example, if we pay a premium of 20,000, we will pay -20,000.
  2. In years when we get some money, we have to put positive value, like if we get 20,000 in some year, we have put +20,000.
  3. If we pay a premium of Rs 20,000 in some year and we also get 25,000, eventually, the money coming to us is Rs 5,000, so we put +5,000 for that year.

Bonus Quiz to test your understanding!

Ajay bought a pension plan with maturity tenure of 15 yrs , but his premium paying term was only 10 yrs . So he does not have to pay anything after 10th year .

He is paid the premium of Rs 40,000 each year for 3 yrs, but after that he missed paying premiums for 4th and 5th year. He revived his policy in 6th year and payed 6th year premium along with 4th & 5th year premium with 8% interest (8% interest on 80,000)  in the 6th year and thereafter He continued paying the premiums after that till 10th year . After the maturity period of 15 yrs, he has two options

Option A) Get 4,00,000 lump sum + pension of 25,000 for next 40 yrs , starting from 16th year

Option B) Take the lump sum of 10 lacs and Policy terminates

Question : Which option should Ajay choose ? which one is better than the other ?

Lets see who gives the right answer !

So now if someone tells you that you can invest Rs XXX for Z yrs and get amount Y for next ABC yrs you can find out how much IRR its turns out to be , if its claims to be a safe fund and IRR is more than 9-10% , you can clearly see that its a pure cheating ! .

Your Homework

Now go back and take out your ULIP’s , Insurance Plans and use this method to find out what is the return you are getting out of those policies , are you satisfied with it? if not , its time to rethink if you really want to continue those plans or not . Take Action !

So , go ahead and calcualte the IRR for your policies and ULIP’s and Share your examples and numbers with everyone on the comments sections ,  I will personally verify each one’s number and confirm if those are right or not . Happy IRR’ing !

LIC Bima Account Policy [with Return analysis]

LIC Bima Account is the latest product launched by LIC of India on this festive tax season (generally known as JFM, JAN-FEB-MARCH, Tax saving season). There are mainly two varieties of this insurance plan called LIC Bima Account 1 and LIC Bima account 2, which differ a bit in terms of premiums, tenure, etc. No wonder that it’s the best time to launch the insurance plan as everyone is looking forward to investing in tax-saving, and when something has a tag of “Guaranteed returns” + “LIC” , its an instant favorite :).

LIC Bima account comes under sec 80C, you can save income tax on the amount invested.  A lot of risk-averse investors will be investing in these plans. However, It’s important to know what these plans have to offer in terms of returns and see if it’s as transparent as it looks like. The company claims to pay a 6% return, but will it be 6% by the time it reaches your hand? Let’s look at it.

LIC Bima Account

Did you notice the above picture? It’s very much related to our financial services industry. Every other financial product has a face, which is shown to public, but if you analyze it further and look at  it from the mirror of IRR, you can see its real face which is too horrifying sometimes .. Be it ULIP’s, Endowment plans and even PMS schemes, every other product has some real face which we need to find out . I have tried it find the real face of LIC Bima Account policy here. It’s up to you to decide is it beautiful or not!

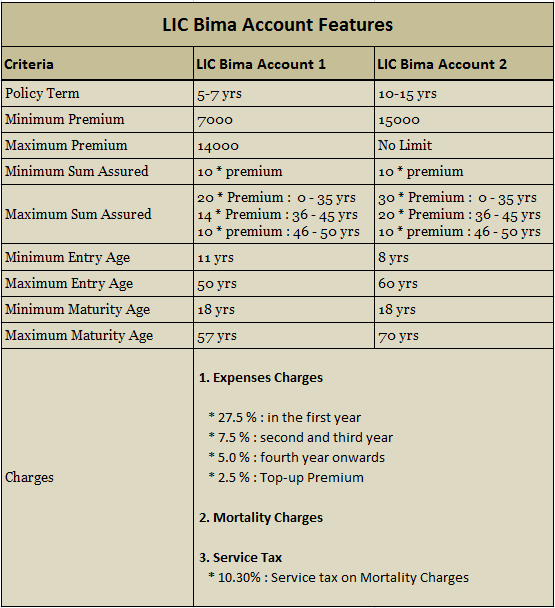
Features of LIC Bima Account 1 and LIC Bima Account 2

The chart below gives you an idea of both the variants of the policy. While LIC Bima Account 1 is for investors who can pay smaller premiums, Bima 2 is for investors who are looking fo paying higher premiums.

LIC BIMA ACCOUNT INSURANCE PLAN

The lock-in period for these policies is 3 yrs, You can surrender the policy after paying the premium for 1 yr, but you will be paid back only after completion of 3 yrs lock-in period. The common part of both the plans is that you will get 6% returns from these plans if you continue paying the premiums till maturity, but only 5% return if you make it as paid-up policy. There will be a bonus also paid by LIC in these plans, but it would depend on the company experience with the plan and bonus is not guaranteed. Also the bonus will only be applicable for investors who have completed the whole tenure.

Important: Taxation of LIC Bima once DTC is in Force

Another important point worth nothing is taxation of LIC Bima Account policy after the Direct Tax Code is in effect. As per DTC, the tax exemption will be allowed only if the Sum assured is more than 20 times the yearly Premium, however, both LIC Bima Account 1 and LIC Bima Account 2 offers options where a person can choose Sum Assured which is less than 20 times the yearly premium (see the chart above).

In that case, they will be able to claim the tax deductions in this current year and next year also, however there after they won’t be able to claim any deductions on this policy. I am not sure how many investors are looking at this point. The majority of investors in LIC Bima are going to be from small cities, who will definitely have no idea about this taxation point.

Commission for agents in LIC Bima Account 1 & 2

So what is the commission LIC agents will make from selling these policies? Here are the numbers shared by an LIC agent with me over the phone.

  • 16.5% for first year
  • 3.5% for the second and third year
  • 2% for 4th year onwards

What are the returns from LIC Bima plans?

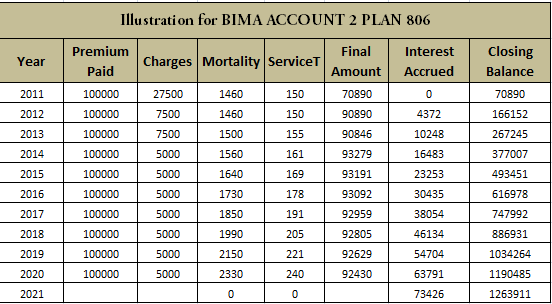
This is where one has to pay attention to. Note that the returns of 6% are offered only in the Net amount invested (Final Amount in the charts below). We will take an example of LIC Bima account 2 Plan 806 below which I got from. Suppose you invest 1,00,000 per year in this plan for tenure of 10 yrs,  then at the end of the tenure you will receive 12,36,911, guess how much actual return does it translate to? So we have to do an IRR analysis for this to find out the actually CAGR return an investor will get. As per IRR analysis, the returns turn out to be 4.217 %. So this is the return an investor would earn in 10 yrs, note that is the return without considering any bonus.  For investors who will make the policy paid up or surrender it, for them the IRR would be drastically low and might be as low as 0% or negative also depending on how early investor makes it paid up.

Look at the chart below which shows you the IRR analysis for LIC Bima Account 2 policy, The numbers below are provided by an LIC agent over email to me.

LIC bima account insurance plan returns

So the main point here is that why is an investor not informed about the actual return which he gets in his hand? Why the returns of 6% are shown in a way that common public will not be able to find it out. One can also show the returns like 9% or 10% and then increase the charges to such a level so that the investors in hand returns are just 4-5 %. These plans are going to generate a lot of attention and crores and crores will be generated. Do you feel it can be called misselling or Mis-use of Public trust, as the returns are in a way misleading? This is a question from you as an investor !.

A trusted source Dhawal Sharma had a talk with LIC Development Officer and here is what he found out –

I met with an LIC DO yesterday and he explained to me that BIMA ACCOUNT is for someone looking for other option than Saving Bank Account and thus the name.. Bank Account gives 3.5% and here it is with Minimum Guarantee of 6%, that too with Insurance Cover and tax benefit.

It’s another LIC stunt of JFM (JAN-FEB-MARCH) Tax saving season..Remember, LIC launched WEALTH PLUS last year on 8th FEB…Crores of policies were sold and crores of premium was raised by LIC in 2 months flat..I am eye-witness to last year’s madness when LIC agents were asking people to come along with FILLED FORMs for WEALTH PLUS and public obliging..and there we were, the KOTAK (or PVT PLAYERs) doing everything for the client but still being made to look second-grade in comparison to LIC..That the NAV of WEALTH PLUS now is Rs 9.63 is a different matter altogether 😉 Just wait and look for a new product from LIC every year in FEB..

Actually its not misselling, its MISSUSE of the TRUST that people have in LIC..”Whatever LIC come up with must be good” according to Indian public and thus the result..

Note that the actual returns from LIC Bima after considering the non-guaranteed bonus will be higher, but still it would hardly be attractive enough.

Comments? Are you buying it? What kind of investors should buy LIC Bima Plan?

Is Stock Market Crash on the way ? [ 4 charts ]

Did you invest in ELSS recently for tax saving? If you have done that with the intention of getting quick great returns in 3 yrs and then liquidate the funds, you might not like this article. Indian stock markets are seeing some serious sell-offs in the last 1-2 months and there are some reasons for it. In this article we will look at some indicators which can help you take further decisions.

Stock Market Crash India

Why Nifty Started Falling from levels of 6300?

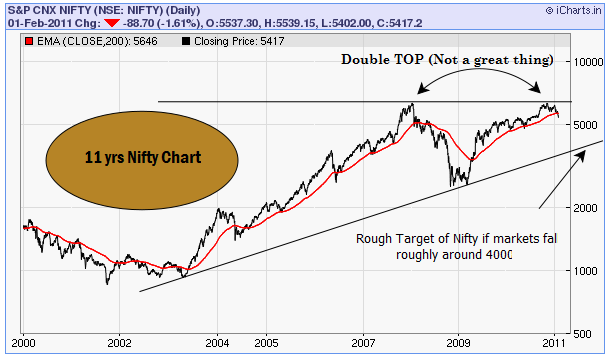
You should ask why shouldn’t it fall? Everyone has bad memories about markets and 6300 in nifty is a level from where we saw one of the biggest crashes in 2008. A lot of investors had a really bad experience at that point, as they were stuck at that point and could not sell-off in 2008. They kept their stocks with them in the hope to sell it off next time when the market reach the same levels. This is what exactly happened when markets reached the levels of 6300 recently, everyone said .. “BOSS. I am now getting out of markets as I have reached my previous levels, No matter what happens next, I am just out !”, which is very natural and well-known phenomena is markets.

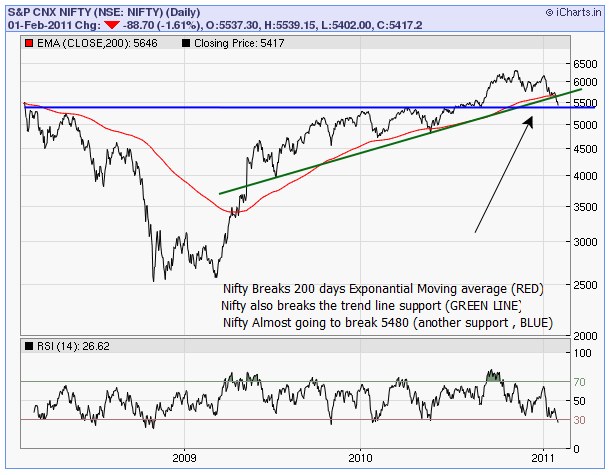
When the majority of people do this,  there is serious sell-off suddenly. In technical terms, this phenomenon is called Resistance and we can see a probable double TOP at the level of 6300, not a very great thing for people looking to BUY :). I say probable double top because it will only be confirmed after markets break the target of 5350 at nifty (got this tip from Nooresh Merani). It would be a bad situation to watch ours for. Look at the last 11 yrs chart of Nifty below.

Stock Market Crash

3 major indicators indicating the fall in Indian Markets

There are some serious events which are worth looking at. Let’s look at them

1. FII’s are selling

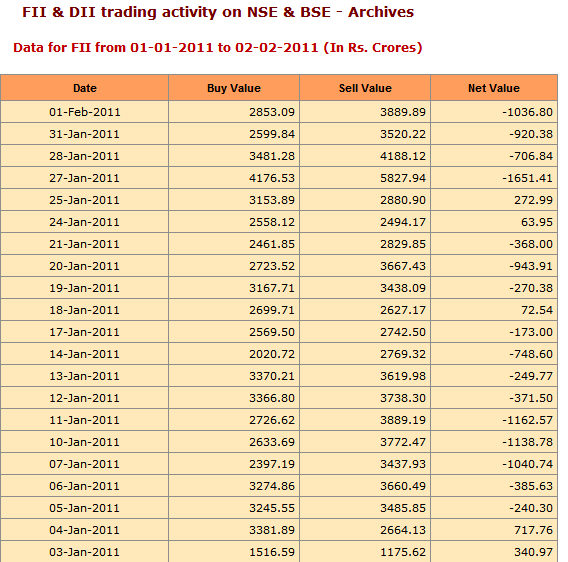
The biggest reason for the current market fall is due to FII (foreign institutional investors) selling off. Suddenly American and European markets are looking better than Indian or Asian Indices. Note that US markets are rising from last some months and Europe has outperformed Indian markets by 20%+ in Jan alone. FII’s have sold a lot of in the last 1 month, below is the data are taken from the NSE website.

FII sold in Indian markets

However, not everyone agrees to this argument. “FII’s have invested around 50,000 crores in Indian markets from the point when Nifty was around 5,400 last time, which was around Aug 2010,  However FII’s have sold taken out just 15% of what they invested, and right now we are at the same levels , so still lot of FII’s money is lying around.

So, the biggest reason for the fall is the fear of rising inflation and interest rates and the way it will affect our markets and economy in coming days”- says Deepak Shenoy of Capitalmind.in .

2. Markets broke its 200 day EMA + important Support points

This is not a small thing to ignore, breaking of 200 EMA is a significant event, and it has happened only twice in last 2 yrs, but it bounced back from that point, However, this time it has broken it again and got below it and not bouncing back. Incase it does not bounce back above it, It’s not a comfortable situation. So if you know GOD personally, please pray.

Look at the 3 yrs chart below which shows the 200 EMA breaking and other trend line breaking. Learn more about Support and Resistance and other important things related to stock markets here, here and here

Should retail Investor Buy right now for the long-term?

I had a talk with Nooresh Merani, a technical analyst at Analyse India, and he feels that the main panic button is still not triggered.

As per him – “The major point comes at 5350 on Nifty which is very crucial, we can not say we are entering a Bear market unless market crashes below the levels of 5350. If that is broken, then there can be further weakness in Indian markets and sell off, However if markets bounce back from these levels of 5350-5400 and go up further, it would be safe to buy only if markets move above 5700 levels , unless then better to be high on cash and not take any action. If markets can move above 5700 again , it would be a great idea to deploy cash and see levels of 6800-6900 on Nifty” – Nooresh Merani (blog)  .

Stock Market Crash

3. Nifty PE touched 25 and now moving down

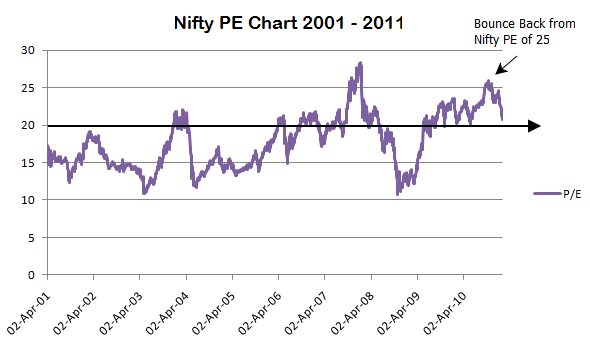
Please read this post on Nifty PE incase you have no idea what is it. Nifty PE has been a good indicator till now to show the over-bought and over-sold regions and we can expect it to be a good indicator. In the last 10 yrs, It was the second time when Nifty PE went beyond 25, Only in 2007-2008 it was around 27-28 and even body knows what happened after that. Even now Nifty PE touched 25 and now it’s moving towards 20, I would not be very bullish for long-term in this kind of scenario. But there are cases where it has bounced back from 20 again to move higher, so keep it as a possibility. See the chart below which shows you the Nifty PE movement in the last 10 yrs.

NIFTY PE indian stock markets

Conclusion

Technical analysis is an art of reading charts and there are some serious concerns seen in the chart, however, it’s not at all recommended to take the words on rock and believe it blindly. This article and the information here are to facilitate your decision-making process. By no means, this article suggests you sell off anything.

If you are a long-term investor with monthly SIP’s running in Mutual funds, you should better concentrate on what you are good at in life and keep your SIP’s running. Only traders or short-term investors trying to catch the market movements should take decisions based on the information provided. Also if you are going to invest in markets or mutual funds for 1-3 yrs and are a first-time investor, you should understand that there is a possibility that you do not get much out of markets in returns.

Comments please. Give your comments on the charts above and what do you think should be the next move? Let’s not predict, but prepare ourselves for whatever happens next.

Note : Nifty was at 5526 at the time of publishing this article .

Post Office Monthly Income Scheme (POMIS) – How it works and Rules

Are you looking for a safe option to invest your money and earn decent returns? If yes, then I can explore one of the post office schemes. Today, we look at post office monthly income schemes (POMIS) which are not that well-known among urban investors. We often look to fixed deposits and other debt options to park our money or generated monthly income. But the monthly income scheme post office offers myriad possibilities. Let’s explore!

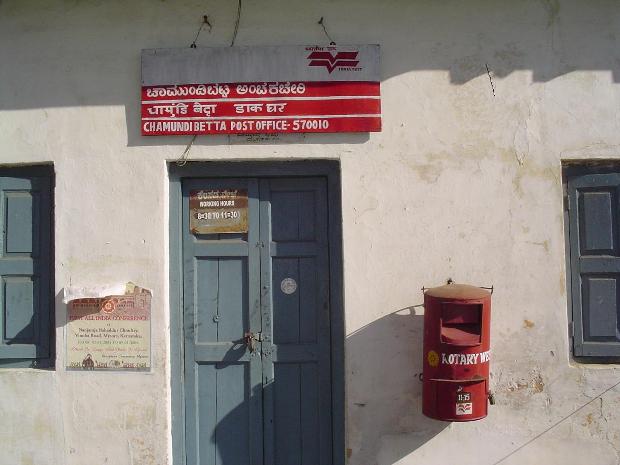
Post Office Monthly Income Account

Post Office Monthly Income Scheme is one of the post office schemes which gives you a guaranteed return on your investment. Anyone who wants to generate a monthly income can open this account and get an assured monthly income. You get an 8% interest per year, which is payable on a per month basis. You will get the interest each month from the date of making the investment, not from the start of the month.

For example Ajay invests Rs 4.5 lacs in the post office monthly income scheme. His interest per year is Rs 36,000 @8%, hence he gets Rs 3,000 per month as income. If you do not withdraw the amount for some month, it would not earn any interest and just lie in the account.

This post office saving scheme does not come under sec 80C so there is no tax-exemption for the amount you invest in this, and interest income is taxable, but there is no TDS cut in this scheme. Read 7 Tax saving Tips

You can deposit the money in the POMIS with cash, demand draft or local cheque. Once you open a monthly income scheme account, you will be issued a scheme certificate and a passbook to record the transactions against the post office MIS scheme.  The maturity period of this scheme is 6 years. You will also be eligible for a 5% bonus if you retain your scheme foe 6 years, so eventually, your overall return including this bonus can turn out to be around 8.9 %.  There is a limit on the amount you can invest in POMIS. It’s limited to Rs 4.5 lacs for a single account and 9 lacs for a joint account. You can have any number of accounts, but within the overall upper limit.  There is no compulsion to take your money out after maturity, you can leave the money in the account, but then it would earn the interest equal to saving bank account for the next 2 years only.

Getting Interest income in your Saving account

You get to withdraw the POMIS income amount by directly going to the Post-office. However, there seems to be a bit of confusion,  if you want the income in your savings bank account. According to per some resources, you can get it credited to your savings bank account,  provided it’s in the same post-office. But elsewhere, some guys confirm that you can provide ECS information at the time of opening the account and get the interest amount created in your Bank account (see the list of cities covered by Post-office). I found the comment below on this website, where a user claims of using ECS.

YES! you can opt for a ECS facility whereby your monthly interest amount will be credited to any savings account of your choice (here HDFC). After you open the POMIS account, you need to fill up the ECS form, attach a blank cheque of your HDFC savings account and you’re all set. You don’t need to open a Savings account at the Post office just for credit of monthly interest.

The information I’ve given here is authentic, because I’m personally using the ECS facility.

Pre-mature Withdrawal from Post-Office monthly Saving Scheme

Even though the maturity period for POMIS is 6 yrs , there is a facility to break it and take your money out. However you can take your money only after 1 year. You have to pay some penalty which is as follows

  • If you break it within 1-3 yrs: 2% penalty on Deposit amount
  • If you break it after 3 yrs: 1% penalty on Deposit amount

Example: If you deposit Rs 1 lac in  POMIS , and want to take money out in 2nd year,  you will have to bear the penalty of 2,000 and you will get back 98,000. If you take money out in 5th year, you get 99,000.

Confusion of returns by mixing POMIS along with RD?

There are some claims which say one can invest the monthly income coming from Post office monthly income scheme into the Post office RD and earn a return of 10.5 %. This at first looks amazing, but its kind of untrue and marketing gimmick. I did a XIRR analysis of the whole cash flows and found out that considering everything , your final and actual return is just 8.77% , which means that when you invest your money in POMIS , direct all the monthly income to an RD and at the end when you get the maturity amount along with the bonus of 5 %, in total you have made an annual return of just 8.77%, which is quite ok considering the safety and conservativeness of the product. But considering the tax to be paid at the end of the tenure, again you might not get great Real Returns! , Remember that the RD comes for the 5 yrs, but it can be extended for 1 more year and it can be made for 6 yrs.

Returns from POMIS + RD

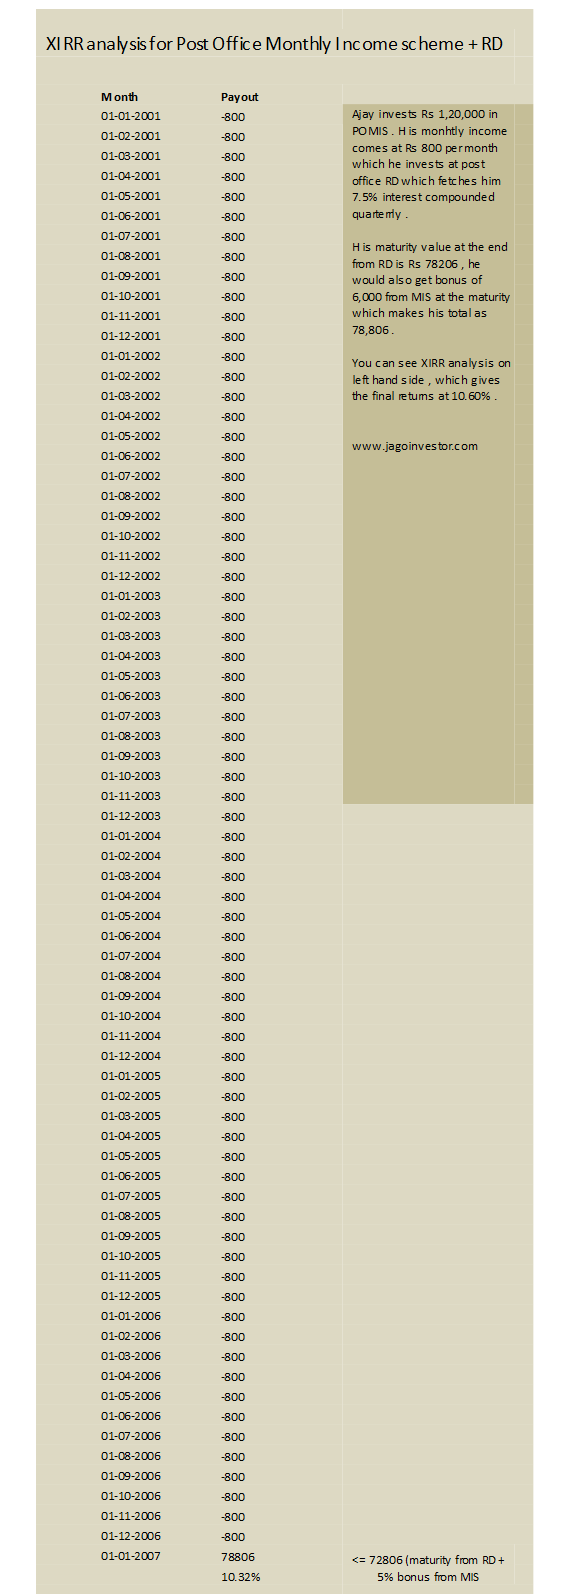
However, the Post office website claims that you earn 10.5% when you put your monthly income into an RD, which is just to attract investors and not give a complete picture. This 10.5% figure is actually only after considering the bonus amount you get at the end, If you remove the Bonus of 5% from the scene , then the return drops to 7.92% . In the below example, you can see that a person who has invested Rs 1,20,000 will get Rs 800 as monthly income , and he gets 72808 as maturity amount from RD, 1,20,000 back as the initial investment and 6,000 as bonus amount .

Scene 1 : If you consider the 800 payment per month in RD for 6 yrs and the maturity amount of 72,806 at the end of 6 yrs , then the returns are just 7.92% (XIRR)

Scene 2 : If you consider scene 1 along with the Bonus amount also , which means you get 72,806 + 6,000 Bonus also = Rs 78,806 , in that case your returns are 10.32% , but its misleading as this bonus is the cost of your 1,20,000 getting stuck at one place for 6 yrs and not an RD feature . So this is not the right way of looking at it . (See chart above)

In case of scene 2 into consideration , then the return from “Only POMIS” is just 8% , but if you consider POMIS + Bonus only then its 8.91% .

Note that this setup operates automatically, you have to set up this once and then no more overseeing. It will happen automatically each month (official link)

Other Features of Post Office Monthly Income Scheme

  • A minor above age 10 years can open an account on his/her own name directly. There is a limit of 3 lacs for guardian and it would not be clubbed with guardian limit (More on Clubbing rules)
  • Non-Resident Indian / HUF cannot open the Account.
  • Interest not withdrawn does not carry any interest.
  • Your POMIS account can be transferred  from one post office to any Post office in India free of cost.
  • The amount deposited in POMIS is exempt from Wealth Tax

Nomination

You have to make the nomination for your Post office monthly Income scheme at the time of applying, however, if you don’t do it at the time of opening, you can also do the nomination later. Incase of the death of the account holder the money will be paid to the nominee.  Read more on nomination here.

List of Best Equity Diversified Mutual funds for 2010

Want to invest in the best mutual funds in India? Read on. I have compiled a short list of Mutual Funds which are top mutual funds in the Equity Diversified category. These are long-term winners in their categories and have proved their performance over the years by beating their benchmark and category average by a good margin. These are non-tax saving Equity diversified mutual funds that are large-cap oriented. Remember that I am giving a list of funds. These are funds that have more than half allocation in large-cap oriented companies and around 50% of their money in the top 3 sectors they hold. Based on these criteria, I am putting 7 best mutual funds along with analysis, some of these are very old and some are relatively newer. (last year list)

List of Best Equity Mutual Funds

Source: valueresearchonline.com

Portfolio & Sector Allocation

All the above funds have returned around 20% or more in different time frames consistently, which is very encouraging when you want to invest in these funds. However our concentration this time is large-cap oriented mutual funds, we are not including funds that have a high concentration in midcap or small-cap funds. Let’s look at these mutual funds share in Large or Giant Companies. My criteria were to have at least 60%+ in Large/Giant Companies and around 50% allocation in the top sectors they invested in. We also have funds expense ratio which is around 2% for each of them. Read Magic of SIP

Source: valueresearchonline.com

Fund Manager and a Brief Overview of Mutual Funds

Past performance is just one of the criteria we can look at, but it’s not enough and not a guarantee of how it will perform in the future. Let’s also look at who manages it and how these funds have done so far overall as per their mandate and investing philosophy. Please note, that we are talking about the Growth option here and not the dividend option.

HDFC Top 200

HDFC Top 200 is one of the most well-known Mutual Funds in the country. It’s an amazing performance of 26% CAGR in the last 14 yrs is proof. 10 lacs invested in HDFC Top 200 since Inception is worth 2.54 crores (non-taxable) today compared to 30 lacs in FD (taxable). Some achievements of funds are that in the 2008 bear market, HDFC Top 200 was able to restrict its fall to 45% only, which was 11% less than its benchmark and 8% less than its category. Prashant Jain is the Fund Manager of HDFC Top 200 and one of the best known and famous Fund managers in the country with a long term experience.

Prashant Jain’s Investment Approach: “The criteria that go into selecting stocks/sectors are quality, our understanding, growth prospects, valuation of businesses and the composition of the benchmark – BSE 200.”. The fund has good 20% allocation in Midcap or small-cap stocks which gives a kicker in returns.

How to look beyond short term returns in Mutual Funds

DSP BlackRock Top 100 Equity

DSPBR top 100 is not a decade old fund, but its performance is strong enough to say that it’s one of the best in the category as of now. The fund has given enough proof of its performance like even in the first year of its launch it gave an amazing 129% return beating its benchmark by an “oh my god” 29% return:). It also showed its capacity to restrict loses in the bear market of 2008  by falling by only 46% compared to its benchmark which fell by 55 %, thereby giving a better performance by 9 %. The best thing I liked about this fund is that this fund has provided very strong performance by mainly focusing on large-cap companies, the fund allocation in Large-cap companies stands at 94% which is outstanding. This clearly shows the competence of Fund manager Apoorva Shah who is managing the fund for the last 3 yrs.

Birla Sun Life Frontline Equity A

This is another winner in the long run. Over the years Birla Sun life frontline equity has consistently outperformed its benchmark by a good margin. During the market falls of 2004, 2006 and the big crash of 2008 and early 2009, This fund was able to restrict downsides better than its benchmark. The fund is largely Large Cap oriented, however the fund is known to take some risks in Midcap space and hence has seen one-quarter and its first year lagging behind its benchmark, but that was not a prolonged behavior, over all it has done great. The main reason it came to top in performance was the entry of Mahesh Patil as the fund manager in Nov 2005.

HDFC Equity

This fund is for long-term investors because HDFC Equity does not hesitate to take risks. Having a good allocation in midcap/small-cap companies, Its performance comes by being invested for long-term, which means short-term volatility in its performance. Being 15+ yrs old fund, have shown its performance over and over again, this one is for people who really like to play with mutual funds on a long-term basis. The fund manager is again star performer Prashant Jain, who took over this fund in 2003 and the fund has never looked back. Just to give you a flavor, the fund in 2009 has given 30% more than Nifty Index and in the last 1 yrs itself, it has given 42% return compared to just 15% from Nifty. You can count this one as an aggressive large-cap fund for investors with a strong heart and long-term vision

UTI Opportunities

As the name suggest, UTI opportunities are for you, only if you a risk taker and like to bet on different opportunities available in the market. As per the mandate of UTI opportunities it looks at the gaps available in the market and the sector and pics the stocks which are really undervalued and might outperform in the future. As per the fund mandate, the Fund manager dynamically shifts between sectors depending on the macro economic outlook and opportunities available in the market. This means the potential of a huge upside as well as the risk of getting wrong. After Harsh Upadhyaya took over in 2007, the fund has done wonders and has given returns double than its benchmark, which is impressive. So if you a kind of investor who likes to take chance on opportunities, UTI Opportunities should be in your Portfolio.

Reliance RSF Equity

Reliance RSF has shown some impressive performance over the last some years. However the fund is fairly aggressive in nature and is known to take risky calls whenever it finds good opportunity, despite being called a large-cap fund, Reliance RSF has large amount (45%)  of portfolio in small and mid-cap stocks at the time of writing this article, The fund did not really do very well when it started, but within a year it came on track and then showed good performance. Remember that this is a risky fund and can be actually compared to mid-cap funds in some sense given its nature of taking risks. So it might not suit you if you like to take long-term calls and want to be on the safe side. The fund is also known to churn its portfolio faster, so be cautious.

UTI Dividend Yield

This fund is really special. UTI Dividend Yield is another gem in the basket of Diversified mutual funds with a different style of investing. This is one fund, which has a woman for a fund manager in Swati Kulkarni, who has done a wonderful job in managing the fund till now. As per the mandate, the UTI dividend yield fund should make an investment of at least 65 percent of the portfolio in equity shares that have a high dividend yield at the time of investment. The fund has managed to successfully deliver on its commitment and has never deviated from its words. That’s called ethics and focus. Due to this, the fund has given a strong performance and because of its nature of strategy, the downfall is always restricted well. Ladies would like to invest in this fund given they like to play safe and it also comes from a lady fund manager 🙂 (Women & Personal Finance in India)

Which one should you invest in?

Remember that you have to take a call based on what your time frame is and which fund suits your requirement, Overall, if you are too confused in choosing the fund, I would say the best thing would be to choose any, randomly and invest rather than delaying your decision because of confusion. Another thing which you should understand that this is not an exhaustive list. There are enough funds other than these which could have been here in the list, but I have not included them as these 7 funds were the one which came on the top as per my criteria and also because I wanted to limit the number of funds to a single digit so that one can choose with less confusion. Also, make sure your asset allocation is correct

Disclaimer:  Note that these funds are pure equity funds and just because they have performed excellently in history does not make them future star performers. This is just an assumption, that they will keep doing great even in the future given their investment style and integrity in management till date. Also, you have to make sure you review your investments every year so that you throw out the laggards and pick better funds. Expect around 12-13% in the future even though they have high potential. This article should in no way be treated as an encouragement to invest in these funds. Your decision is purely yours 🙂

Comments: Which other funds did you expect in this list? Do you have other funds’ names which deserved to be here according to you? Do these funds suit your requirements?

Making sense of the market through Sensex at MRP

In the previous article, we looked at Stocks@MRP and how a stock can have a price tag. Moving further, we now discuss how the concept of Stocks@MRP has been extended even to the benchmark index :

Sensex . Also there is an example of one stock each considerably above and below its MRP. The inherent volatility in the stock markets makes stock investing to be perceived, by many, as a gamble. However, the Stocks@MRP can help us get a very good idea about the worth of a stock.

Once we know the MRP of a stock, we should buy it at a 50% discount to its MRP and sell it if goes considerably above its MRP. Then, how does Sensex@MRP come into the picture? And why do we need to find out the worth of the benchmark index as well?

Sensex markets india

Going back to History

Let’s jump back a bit in time. It’s December 2007. The Sensex is close to 20,000. The media is going gaga over the Indian economy and the movement of Sensex (up by 55% in just 9 months) and is saying that the next stop is 30,000. Everybody is eager to jump onto the bandwagon.

Fortunately, you have been a part of the rally since the beginning and have seen a considerable rise in your holdings. So, what do you do? Do you sell off and book your profits? Or do you wait? After all everyone is saying that this is just the beginning.

You wouldn’t want to look like a fool selling too early and missing out on the further upside, would you? You stay in and within a few months, you regret your decision.

The market crashes (falls by 50% in 1 year), your stocks tumble and a large portion of your wealth is wiped away. All your companies are still doing well, they are still fundamentally strong. Yet, you have suffered because of the market’s over reaction to the sub-prime crisis.

You may have not lost your capital, if you bought your stocks at a discount to the MRP, but your profits have definitely vanished!

Sensex@MRP concept

Warren Buffett, one of the greatest investors in the world has said, “Be fearful when others are greedy and be greedy when others are fearful”. But to do this, you need to be aware when the others are being greedy and when the others are fearful. And this is the quest that exactly led us to finding Sensex@MRP.

The market represented by Sensex is known over react, to both positive and negative news. Be it national or international politics, capital inflows or outflows and favorable or unfavorable monsoon forecasts; the Sensex fluctuates widely because of these.

Even though Sensex is comprised of just 30 stocks, chances are that if these big names get hit, a majority of the other stocks also get clobbered. This thought led us to the logical extension of finding Sensex@MRP so as to enable investors to enter stocks at bargain levels and help them exit when things start getting over-exuberant!

The Sensex companies are some of the biggest and most well known names in the country. They are amongst the favourites amongst the institutional investors and hence are highly liquid. One can then expect these stocks and as a result the Sensex to trade close to the fair value i.e. MRP.

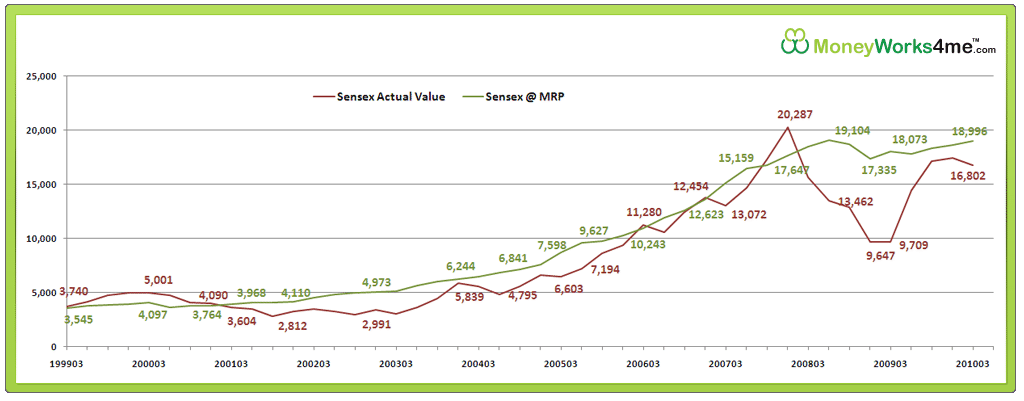
However this has seldom been the case. On quite a few occasions, the market has become irrationally exuberant or highly depressed. Knowing these phases of the market can help you become better investors. The graph below gives you a comparison of Sensex@MRP values plotted against actual Sensex values for a period of 10 years beginning March 1999.

Click on the graph below to have a look.

Sensex at MRP

Movement in Sensex along with its MRP

  • March 1999 to December 2000 saw Sensex quoting consistently above its MRP. Many of us will remember this time as the Technology boom. During this time Sensex was trading at a multiple of 30 times earnings. As the Sensex was clearly above Sensex@MRP, this was a good time to ‘Sell’. As expected a correction took place and within a year, Sensex was trading 15% below Sensex@MRP.
  • June 2000 to March 2003, saw the Sensex trading at around 30% discount to its MRP. The earnings for the Sensex companies were stagnant during this period but clearly the market was undervaluing them. In hindsight, this was a good period to enter the market.
  • Post 2003, earnings of the companies entered a high growth phase and this continued till March 2008. This is evident from Sensex@MRP which increased from 6000 levels in 2003 to 19000 levels in March 2008. But the market seems to have over reacted during this phase with the Sensex crossing the Sensex@MRP in September 2007 and December 2007. Infact December 2007 saw an over valuation of as much as 15% – a clear sign to Sell and get out.
  • As the sub-prime crisis and the fears of a global meltdown spread, Sensex crashed and reached 9000 levels in December 2008 and March 2009. What is interesting to note here is the fact that earnings of the Sensex companies had not suffered much. Sensex@MRP, which is driven primarily by earnings, was in the 17000 levels. Thus the market was without a doubt over-reacting and Sensex was quoting at almost 50% discount to Sensex@MRP. This was the buying opportunity of a lifetime.
  • Within a couple of quarters, Sensex zoomed up and traded close to its MRP. Considering March 2010 quarter results, Sensex@MRP comes out to 18,996. This means currently Sensex is just about 4% below its MRP. Thus, Sensex is close to its fair value and as investors we need to tread with caution. Quite a few stocks are creating 52 weeks highs and it is difficult to find value picks at the current moment. Infact, some stocks are currently trading well above their MRP and one can consider selling them.

Reliance Infrastructure Example

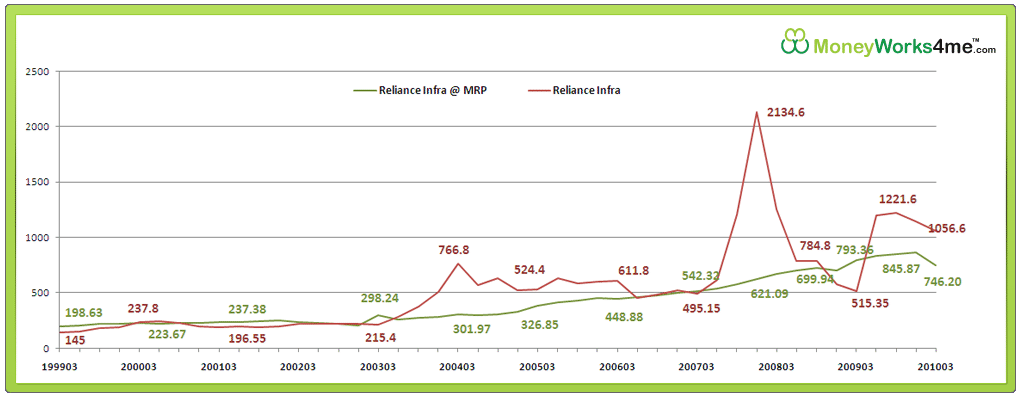
An example of a company quoting considerably above its MRP is Reliance Infrastructure. In 1999, Reliance Infra was quoting at a discount of 20%. It crossed the MRP in year 2000 and remained close to MRP till 2003 inspite of an inconsistent financial performance. Its earnings infact witnessed a drop in 2002 and 2003.

The company’s performance improved post 2003 and the price zoomed above its MRP. In 2004, the stock was quoting as much as 150% above its MRP. This seemed like a sell signal but the stock rose further to unimaginable levels in 2007. In two quarters i.e. from June 2007 to December 2007, the stock more than tripled.

The irrational exuberance of the market was visible as the stock quoted at a PE multiple of 50 at Rs. 2130. The price crashed soon and in March 2009, the stock was quoting at a 35% discount to its MRP. Again, the prices corrected and the stock is currently trading 50% above its MRP of Rs.746.

Reliance Infrastructure

However, even with the market at 18,000, there are a few stocks which offer good value. Let’s take a look at a Sensex company which is currently quoting at a discount to its MRP.

Bharti Airtel Example

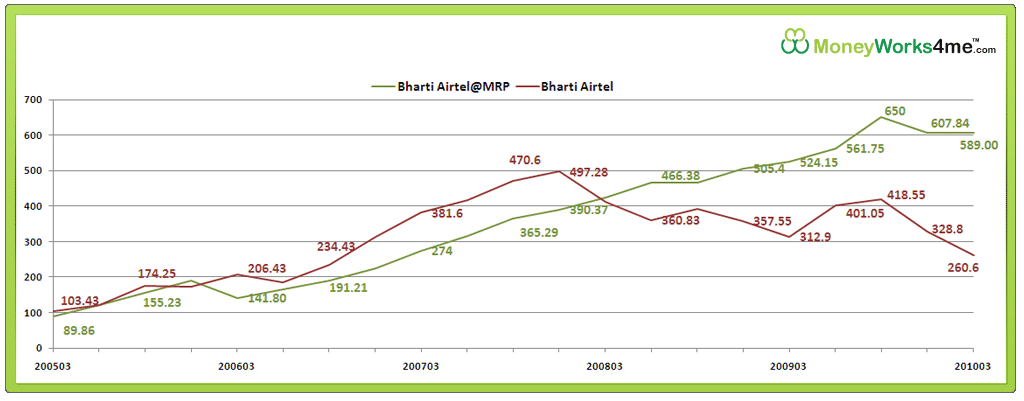
Bharti Airtel currently at Rs. 327 is quoting at a discount of 44% to its MRP of Rs. 589. Click on the graph below to take a look at Bharti’s historical valuations. Except for the initial years, Bharti has always traded above its MRP.

Leadership in the telecom industry coupled with high growth in the mobile market, helped the company record great earnings growth over the years. However, since March 2006 as competition intensified, the premium commanded by Bharti has decreased especially after Reliance Communication’s entry.

Further, the telecom sector has been seeing all sorts of problems including an intense price war, detrimental policies and very recently audacious 3G and broadband license bids. To add to this, Bharti also completed the acquisition of Zain Telecom which led to questions being raised about its financial position.

All this led to Bharti tumble to levels seen in March 2009. However, over the last few weeks, Bharti has picked up quite a bit. Bharti’s MRP works out to Rs. 589 considering an earnings growth rate of 18% which is substantially lower than its past growth rates thus making it a value pick.

Bharti Airtel
Finally, how effective is this concept of MRP especially as it is based on past data? After all as they say past performance is not a guarantee for the future, is it? But as we saw in the graphs, over a long term, stocks tend to move towards their MRP.

So, the rule of buying at a discount to MRP (ideally 50%) and selling above MRP would ensure good returns. Once the stock crosses the MRP, the probability of a correction increases. There is however always the chance of error. There is a possibility of the stock running considerably above the MRP as seen in the case of Reliance Infra.

You may miss out on the upside fuelled mostly by sentiments rather than earnings. But provided you buy the stock at a 50% discount, you would already be sitting on handsome, riskfree returns and hence would rather let this risky upside pass!

What is Real Return and How Inflation eats your money

Recently all news dailies carried the headlines : ‘inflation rate has crossed double digits’. This indeed is worrying. So what is inflation and how does it affect the common man. In simple terms inflation is nothing but rise in the general level of prices of goods and services in an economy. What leads to this rise in the price of goods? It is ‘too much money chasing too few goods’ which leads to the rise in the prices of goods. It is a simple demand-supply mismatch. Because of inflation, our paper money or currency starts losing its value.

Some 15 years back when I saw my first movie in a movie hall it cost me Rs 15 to watch that movie. Now 15 years down the line, to watch the same movie in a multiplex, it costs me about Rs 225. So in 15 years the cost of watching a movie has multiplied 15 times. Now it might cost you Rs 15 just to park your car in the multiplex basement, forget about watching the movie in Rs 15. That’s inflation for you.

Explanation

Let’s take a simple example to understand this. Suppose you have a currency note of Rs 100. Assume that as on today with this currency note of Rs 100 you can buy 1 dozen apples (mind you this is just an example. In real life good quality apples are much more costly and I doubt if Rs 100 will even buy you half a dozen of good quality apples). But you don’t need these apples as on today and need them 1 year down the line. So you don’t buy the apples today as you can’t store them for one year as they will get spoilt. So you invest this Rs 100 for 1 year in a bank fixed deposit which will fetch you 8% at the end of 1 year. Now at the end of 1 year you have Rs 108. But let’s assume that inflation as compared to last year has risen by 10%. This effectively means cost of living or general prices of products have risen by 10%. So now the same 1 dozen apples which were costing you Rs 100 about one year back will now cost you Rs 110. Your money has grown by 8% (Rs 100 has become Rs 108) but the prices of apples have gone up by 10% (price increased from Rs 100 to Rs 110). So to buy the same 1 dozen of apples now (1 year down the line) you will have to put an additional Rs 2 from your pocket. This effectively means your currency or paper money has lost value. This is because of the effect of inflation. If the cost of living goes on increasing at this rapid rate every year, then 10 years down the line I doubt whether the same Rs 100 rupees will be able to buy even a single apple, forget about buying 1 dozen apples with Rs 100.

Had you bought the apples last year you would have managed to buy 1 dozen apples for Rs 100. But since you are buying them one year down the line and the return on investment (8%) that you have earned is less than increase in inflation (10%), you have to put more money from your pocket. So inflation erodes the value of your money over a period of time if the money is not invested wisely.

Nominal Returns and Real Returns

At the time of making investments you should make sure that, you earn a return which is higher than the inflation rate. Many people while measuring the returns on their investment forget to consider the effect of inflation. In the above example if we don’t consider the effect of inflation then our investment in the bank fixed deposit has earned 8% return. But this is not the correct way of measuring returns. This is just the nominal return. The return calculated after considering the effect of inflation is known as the real return. Real return can be calculated using the following formula

Inflation in India

Here r is the rate of return (8%) and i is the inflation rate (10%)

1.08 / 1.10 is 0.9818

0.9818 – 1 is -0.01818

-0.01818 * 100 is -1.8181

So the effective or real return earned on this investment is -1.8181%

So even on the face of it, it seems that your investment has made a return of 8% (nominal return). After considering the inflation rate (10%), the real return is a negative 1.81. Which means actually on maturity you did not make any money, infact your money has lost value due to inflation. Surprised and hence the name of the article – ‘Inflation – The Silent Monster’ – inflation silently erodes the value of your money if you don’t invest wisely. So consider the effect of inflation while measuring your returns on maturity. Use following calculator to find your real investments real return .

Children Education Cost Inflation

Whenever the Weekly or Monthly Inflation Number is declared by the Government, the number represents average inflation which takes into account the rise in the average cost of living. This is a much broader number. If we break down this broad number into different components then we realise that different components have varied impact on individuals. All people are impacted by common things like food inflation and fuel inflation. People who have small children have to prepare themselves for Children Education Cost Inflation and Children Marriage Cost Inflation. So how do Children Education Cost Inflation and Children Marriage Cost affect and why do parents have to plan for this? Let us try to understand this with the help of a case study.

5 Easy Steps to do your Child’s Education Planning

Sample Case Study

  • Let us take the example of Ajay. He wants to make his 1 year daughter, Priyanka a MBA when she grows up. Priyanka will take admission for the MBA course when she turns 21 years old. So Ajay has 20 years in hand to plan for Priyanka’s education.
  • The MBA course as on today costs Rs 4,00,000. If we assume that education costs (inflation) will rise by 8% every year, then the same MBA course will cost a whopping Rs 18,64,382 after 20 years.
  • To accumulate this Rs 18,64,382 in 20 years, Ajay will have to make a monthly investment of Rs 2046 per month if his investments earn a return of 12%. So even though the amount of Rs 18.64 Lakhs seems huge on its face, with regular investments, and the magic of compounding over a period of 20 years, this mammoth target can be achieved with investments of as low as Rs 2046 per month. But the secret to success is to start early and make regular and disciplined investments.
  • If the returns earned by our investments are 15% then the investment amount further falls to Rs 1421 per month. Historically equities have given annual returns in the range of 15% over a long period of time.
  • If the target of Rs 18.64 Lakhs has to be achieved without taking much risk through a Public Provident Fund (PPF) account which guarantees a return of 8%, then this target can be achieved with a monthly investment of Rs 3276 per month.

9 effective financial education tips for your Children

Importance of Starting Early

It is very important for the parent to start investing for the child’s future as early as possible. Starting early allows his money the much required time to grow and reap the benefits of compounding. Let us consider the above example of Ajay planning to accumulate money for Priyanka’s MBA course.

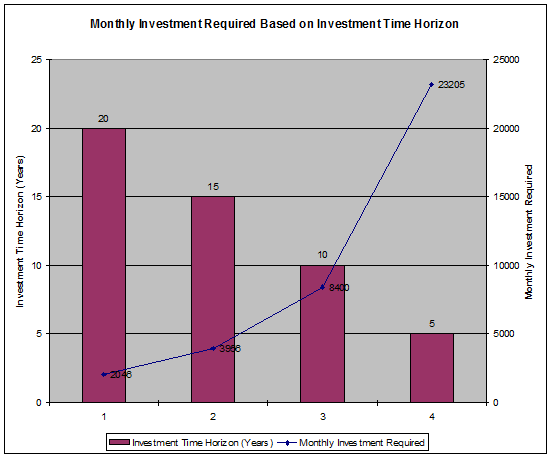
  1. His goal is to accumulate Rs 18,64,382 in 20 years. To accumulate this Rs 18,64,382 in 20 years, Ajay will have to make a monthly investment of Rs 2046 per month if his investments earn a return of 12%.
  2. If Ajay delays the investment plan and starts investment when the daughter is 6 years old, then in this case he will have 15 years to achieve his goal. In this case the monthly investments that he will have to make will rise to Rs 3956 per month to achieve his same target of Rs 18.64 Lakhs if his investments earn a return of 12%.
  3. If Ajay delays the investment plan and starts investment when the daughter is 11 years old, then in this case he will have 10 years to achieve his goal. In this case the monthly investments that he will have to make will rise to Rs 8400 per month to achieve his same target of Rs 18.64 Lakhs if his investments earn a return of 12%.
  4. If Ajay delays the investment plan and starts investment when the daughter is 16 years old, then in this case he will have 5 years to achieve his goal. In this case the monthly investments that he will have to make will rise to a whopping Rs 23205 per month to achieve his same target of Rs 18.64 Lakhs if his investments earn a return of 12%.

Use this Goal Planner Calculator to Plan your future goals .

The below table shows the monthly investment that will be required by Ajay to achieve his goal of Rs 18.64 Lakhs based on his investment time horizon. It is assumed that the investments will earn 12% in all the scenarios.


Investment Time Horizon (Years) Return (%) Monthly Investment Required
20 12 Rs 2,046
15 12 Rs 3,956
10 12 Rs 8,400
5 12 Rs 23,205

inflation in india

The sooner the parent starts planning for the child’s education and marriage the better. These are long term goals and need proper planning. This is the best gift that parents can give to their children. As a parent the sooner you sow the seeds of early investments, the bigger will be the fruit the tree will bear which will take care of your child’s all future needs, primarily education and marriage expenses.

Children’s Marriage Planning

Like education it is the same story for children’s marriage expenses (inflation). If you as a parent feel that today your daughter’s marriage will cost you Rs 7,00,000 then the same marriage will cost Rs 11.27 Lacs 5 years down the line if expenses increase (inflation) at the rate of 10%.

Sample Case Study

Let us consider the following case study to understand this thing better in simpler terms.

  • Sharon has an 8 year old daughter Mini. Sharon needs to accumulate funds for her daughter’s marriage. The marriage is planned 16 years from now.
  • According to Sharon, as on today, Mini’s marriage will cost Rs 4,00,000. If inflation (rise in costs) of 5% is assumed the same marriage will cost Rs 8,73,150 after 16 years.
  • If Sharon wants to make a one time investment which will give her Rs 8,73,150 on maturity after 16 years, she will have to make a lumpsum investment of Rs 1,42,429 (assuming the investment earns a return of 12% p.a.).

But many of us don’t have lumpsum amount to invest and we prefer to make monthly investments. To accumulate this Rs 8,73,150 over a period of 16 years Sharon will have to invest Rs 1,615 per month if her investments will earn a return of 12% p.a.

Watch this video which shows you the effects of Inflation in Zimbabwe and how the paper money has lost all its value.


Conclusion

Last but not the least to end the article here is something for you all to ponder over your money in the bank savings account is earning an annual return of 3.5% and the annual average inflation rate (increase in cost of living) is 5-6%. So if you calculate the real return how much is negative return that you are making or how much is the value that your money is losing???? Think about it

This is a Guest post by Gopal Gidwani , He writes on his blog www.bachatkhata.com