Why to increase sip amount in your Mutual funds

Do you want to increase the SIP amount for your mutual funds ? Or you want to keep it constant always ? A lot of people start with a SIP amount at first and then look forward to increase SIP amount later. This is a very common of every investor and its “how to increase sip amount”

Increase SIP amount

When we say “SIP”, it generally means constant SIP, which does not increase every year. When we calculate SIP amount using any SIP Calculator – the SIP value is generally very high and does not look realistic and at times and such high investment can trigger affordability issue. However there is a clear solution for this, which is used by financial planners and that’s called “Increasing SIP”, where one starts the SIP with a lower amount and then gradually increases them year on year. This looks more realistic as one’s income also increase overtime and ability to invest increases. We see this situation a lot while working with our clients under financial coaching program.

Let me show you the example : Ajay wanted to accumulate 5,00,00,000 (5 crores) for his retirement which is 25 yrs away. When he calculates the SIP amount, it’s coming around Rs 31,000 (assuming 12% returns from equity). Now it’s not possible for Ajay to invest Rs 31,000 every month, as it’s a very high amount. Rather he is fine if he can start with a small amount today and then increase it every year as his income would also increase with time. This is called as Increasing SIP model. If Ajay is ready to increase his SIPs by 10% every year, then he has to start with just Rs. 13,500. This amount is much more convenient for Ajay to arrange, rather than Rs 31,000 per month.

Should you increase SIP amount or not ?

At the first look, a general conclusion which comes into mind is that Increasing SIP is better than Constant SIP because it is much convenient and looks logical that investment should rise as the income increases. But there are different angles through which both the options can be looked at. Let’s look at two important points one by one.

1. Investment required in case of Increasing and Constant SIP

One of the most important factor one can judge both the situation is the amount of investment needed. If we take the above example we just discussed, one would need to start SIP of 31,000 per month to accumulate 5,00,00,000 in 25 yrs assuming 12% return. Now this amount will be constant throughout the all 25 yrs. Where as one can choose to start his SIP with Rs 13,500 and then increase it by 8% per year, but in this increasing SIP model, his SIP amount would reach 50,000 in 18th year and 85,000 in 25th year, which might look very big in numbers, but years from now, it would be worth a small amount considering the purchasing power of money and the annual income one earns. So don’t get surprised by numbers.
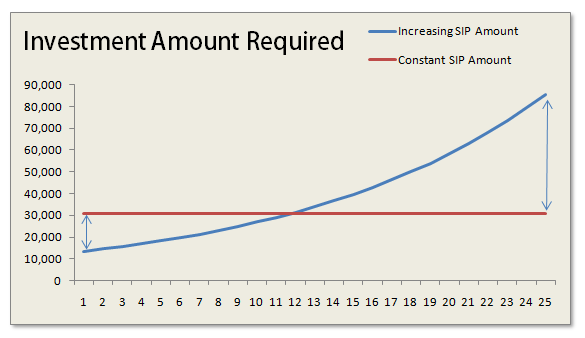
SIP amount increase
One should opt for increasing SIP, when his situation really does not allow him to invest a big amount and he is very sure that he would be able to increase his investments in tune with his salary increase. Truly speaking I am in favour of Constant SIP if one’s situation permits because that way you are investing more in the start of your life and that would help you keep your SIP in check later on in life. Imagine after many years in life, you have to just invest the same amount where as your Income has risen 3X. Isn’t it a big relief and freedom to do whatever you want from your money at that time. Imagine your salary is Rs 50,000 per month and you do SIP of 10,000 and even after 10 yrs, when your salary has risen to say 1.5 lacs per month and you are still doing SIP of Rs 10,000 only. I would choose to pay a little more today and then get into that kind of situation.

Most of the people who are not able to go for constant SIP, because of high SIP amount is because they are very late in investments and now their goals are near and they have less time for compounding. These people have high expenses already in life. Had they started long back when they started earning they could be in a better situation now. Below is the table which shows the Increasing and Constant SIP amounts required for the example discussed above and shows you the ratio of increasing and constant sip. You can see how it started with 44%, but rose to 203% later after 25 yrs.
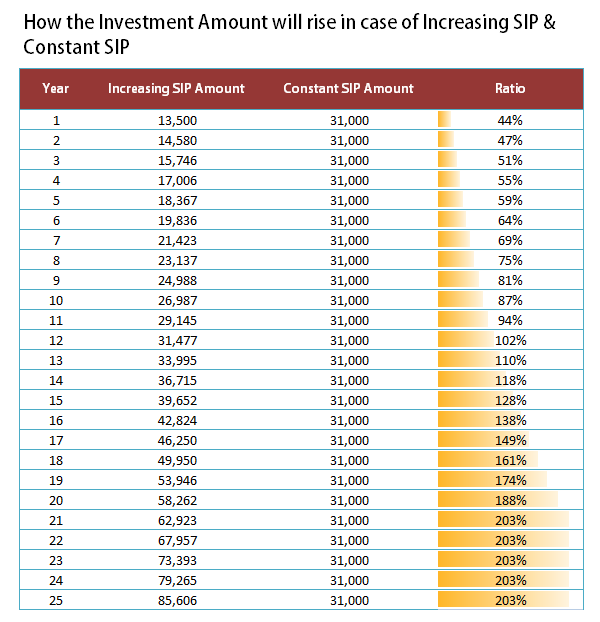
Increase SIP amount

Conclusion

One should start his SIP’s early so that he can keep his SIP’s constant through-out the tenure. If you are late, then your SIP amount will be very high and will look unrealistic and then you will have to increase your Systematic Investment plan (SIP) amount in future if you want to reach the goals.

2. How the corpus will grow in case of Increasing and Constant SIP

The other major thing to look is how your over all corpus would grow in both the cases. Note that in constant SIP and increasing SIP, the final corpus is getting accumulated and they reach the same point at end, but in case of Constant SIP, the overall Corpus is always higher than the increasing SIP and it’s because you are investing higher amount in the start and that way the compounding factor is in your favour. See the chart below which shows, how the gap between the two narrows down at the end of the tenure and both the cases lead to same corpus.
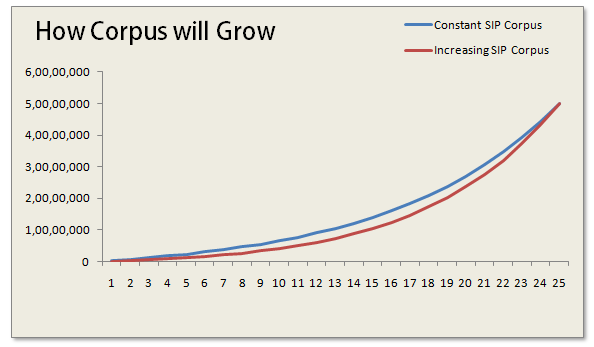
Systematic investment plan money increase

If you look at the table below, you will see that the maximum difference between the two is 36,00,000 in 17-18th year and after that the difference starts coming down (not so clear in table , you need to calculate it) . As you are starting with lower amounts in increasing SIP, the overall corpus is obviously going to be less, but it’s very much above 50% all the time, so if you are saving for long-term, you should be interested in the final corpus.
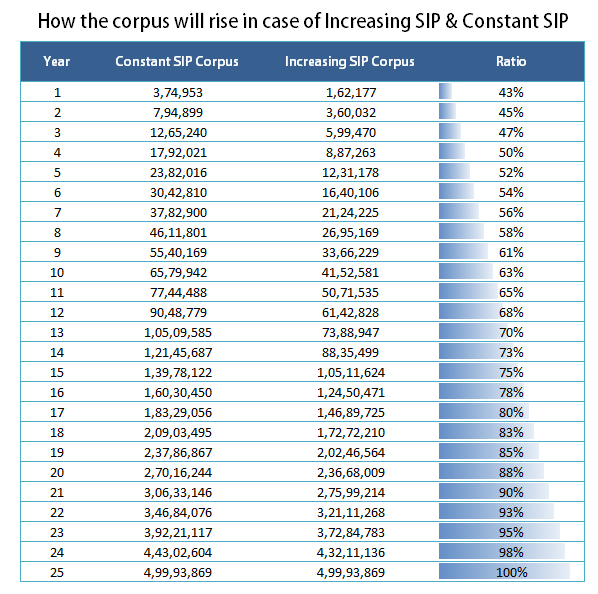
SIP corpus growth

Note that the example and charts above are assuming a 25 yr old tenure and equity returns of 12%. The numbers would change depending on tenure and the equity return, but the overall conclusions discussed above remains same. For a shorter tenure like 4-5 yrs, the constant SIP and increasing SIP won’t differ a lot; it would be a small number.

So the conclusion is that one should keep on increasing their mutual funds SIP amount as and when they can , preferably every year. So are you ready to increase sip amount ?
Review of Portfolio management softwares in India – MProfit, Perfios, Intuit

Which Portfolio Management Softwares do you use ? Some of the Portfolio Management Softwares in India are MProfit, Perfios, Intuit and Investplus and we will see a detailed review of these portfolio trackers in detail. Portfolio Management & monitoring is an important part of managing a good financial life and if your financial life has different components like Real Estate, Loans, Life Insurance Policies, Mutual funds, stocks and ULIP’s. You can also track your portfolio using Excel and there are lot of templates also, but it can be a tedious task to monitor which part of your financial life is doing well and how much worth do you have at each level using an excel template for Portfolio management. Hence, you can use portfolio management software which suits your needs. There are tons of Free portfolio management softwares which you can start with

Best Portfolio Management Softwares in India

There are many paid as well as free portfolio trackers available in the market which you can use to track and manage your financial data. I really recommend using one of these so that you have all the data at one place and you don’t need to struggle every time to find out your own information. Once we put all the information at one place, we get a clearer and a complete picture, which we don’t get otherwise… We are amazed to see our clients find out that they are worth so much or worth so less once we start discussing with them their financial life data.

Some important features of Portfolio management softwares

Now we will discuss some of the most important aspects of portfolio management softwares in India . These points are top level concerns of customers.

Data Security of Portfolio Management Softwares

A very big concern which most of the people have is where will their financial data be (example) ? Will it be on their local computer or will it is at third-party server and this becomes a big blocking point for them to go for those products which stores their data at their end itself. Here I am not talking about the login & password, but the actual numbers of their financial details. A lot of people don’t want their info to reside on other servers. I personally don’t buy that argument, but that’s a big concern for a lot of people. In a survey done by JagoInvestor last month, the number one concern which people had was data security, ahead of pricing and features.

Regarding the security of login credentials, with the advancement in technology and strong security advancements, it has become virtually 99.999% secure if not 100%. A lot of solutions also give an option for users to link their bank accounts, credit card and other online accounts by providing the passwords. A lot of people do not know how it works internally…

An online money manager will work well only if you provide online access to banking accounts for a one-time setup. This raises security concerns, but here is how it works. The login username and password for individual online banking accounts is used to retrieve read-only data. The ‘transaction password’ for online banking should be different from the ‘login password’ for greater security. You don’t have to reveal your ‘transaction password’. Customers do not have to give any personally identifiable information, making the process safer. Moreover, the account is completely anonymous and requires only a username and password. All the banking accounts are linked to provide consolidated data. In the consolidation process, vendors will have access to your financial records on a read-only basis, but privacy policies of these entities should prevent abuse of information. – source : moneylife

Features provided

I was surprised to see that in our survey, most of the people voted for high features and less on simple features. I personally thought that most of the people will love to have something which provides them less, but rich data. But actually people look for lot of features giving them number of reports and graphs. It’s very important for someone using the software getting more analysis and suggestions on what one should do in their financial life rather than just getting some plain info which they would have done on their own. Most of the software providers give good analysis along with different type of reports and charts which you can download in excel formats.

Easy to use

It’s extremely important that the softwares are easy to use because no one would put a lot of time to feed the data at the start and on ongoing basis. A lot of players provide statement upload facility where you can just upload your Bank Statement, Credit card statement or other demat statements and the software will put out the information and feed it automatically, thus reducing your work. Some softwares like Perfios allow you to link your accounts with them so that they can pull your information and feed it themselves (read only).

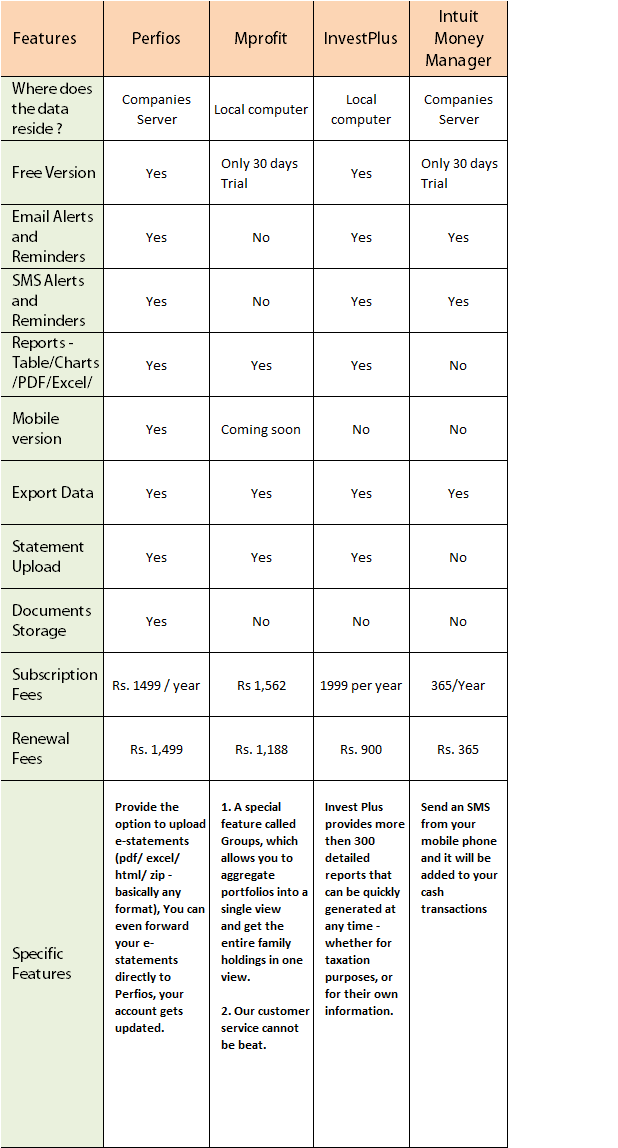
Below is a comparison of 4 major Portfolio management software’s in India market and used by thousands of people (you can read their reviews on their website). They are Perfios, mProfit, Investplus and Intuit MoneyManager

Portfolio management softwares in India

Look at the above video done by me and Manish Jain from Mprofit .

Free and Trial versions

I would say you should take advantage of Free and Trial versions of softwares, Like Mprofit gives away a full functional 30 days trial, where as Perfios and Investplus have free versions which are good enough. If you don’t want to use any software, you can manage your finances at very basic level in an excel sheet, but you will have keep updating the values etc from time to time as the situation changes, which is not the case with softwares, as they auto-update the values.

Free tools for Portfolio management

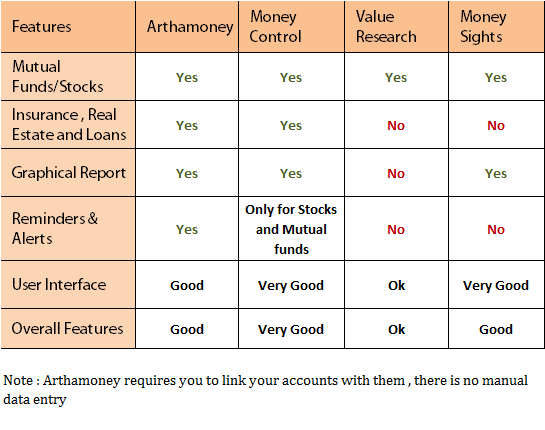
A lot of people don’t go for advanced tools and use free tools available in market which does a good enough job. Tools like money-control tracker and Valueresearchonline tracker are used by lacs of people to track their mutual funds and stock holdings. But they do not give you all the functionalities which fully fledged software’s give to you. Below is the chart explaining Arthamoney, Moneycontrol , Valueresearch and Moneysights portfolio trackers. I hope liked this review of Portfolio management softwares !

Free portfolio management softwares

I would say you should definitely try out some softwares which provide a free version and also explore the free options, there is lot they provide free of cost and all you need is to put your data there. Some other tools which you can use are rediff money (only for stocks and mutual funds, but I like the UI), myirisplus, yodlee and rupeex.com. Please share what more do you look from these softwares and what do you think about the value you get out of these management softwares?

6 Free Portfolio Management Software Licence from Perfios

Update 12 Aug : The 6 winners are selected and this giveaway is not valid now

Perfios is willing to give away 6 free Platinum licences to Jagoinvestor readers for the first year (worth 1499). The first 10 commentators who share this article on their Facebook profile will get those licences (just cc manish at jagoinvestor dot com) (to share it on Facebook, just “like” this article below and put your comment in the box which opens). 

What is Expense ratio in Mutual Funds

Do you know how expense ratio can impact the returns on your mutual funds returns ? We often hear that expense ratio of a fund is 2% or 1.8%, but we never put lot of thought to understand its impact on our mutual funds returns and our own wealth! Lets touch this topic today in detail. For simplicity, I will talk about Mutual funds in this article, but expense ratio as a concept is applicable in almost all the management financial products like Mutual funds, UlIP’s , NPS etc

Expense Ratio Mutual Funds

What is expense ratio in Mutual Funds?

Let me first clear out what is expense ratio? As an investor we just buy and sell mutual funds, but in the background there are many expenses which a mutual fund (and even ULIP’s) has to incur. Some of which are; fund management fees, agent commissions, registrar fees, and selling and promoting expenses. As per SEBI regulations, the maximum expense ratio of an equity fund can be 2.5% and for a debt fund, it should not cross 2.25%.

Now who will pay for this? Obviously you have to pay for it and that’s where expense ratio comes into picture. Expense ratio is cut from your investments on daily basis from mutual funds and only after that NAV is published and that’s how you pay expense ratio. For Example, If you have invested Rs 1,00,000 in a mutual fund whose expense ratio is at 2% and suppose your mutual fund saw a growth of 0.5% in a day, which turns out to be Rs 500. You NAV won’t be 1,00,500. Before that you will have to pay 2%/365 (that’s 365th part of 2% as charges, as it’s for 1 day, remember 365 days in a year) and that would be, Rs 5.48. Hence, final value of your investment would be 1,00,000 + 500 – 5.48 = 1,00,494.50 that’s 0.4945% increase and not 0.5% .

So, the next question which will come in your mind is “So, does this small deduction really make a lot of difference?” The answer is Yes & No. If you are looking at 6 months or 1-2 yrs, it’s not much of a concern, you can probably just avoid it and answer is Yes, if you are looking from long-term point of view like 5-10-20 yrs. In that case it’s mostly something which you can put your eye on once.

Expense Ratio – With & Without

Let me first give you a very clear idea about the distinction between two scenarios where there was expense ratio and there was no expense ratio in a mutual fund. Let’s take this example at least to understand the concept.

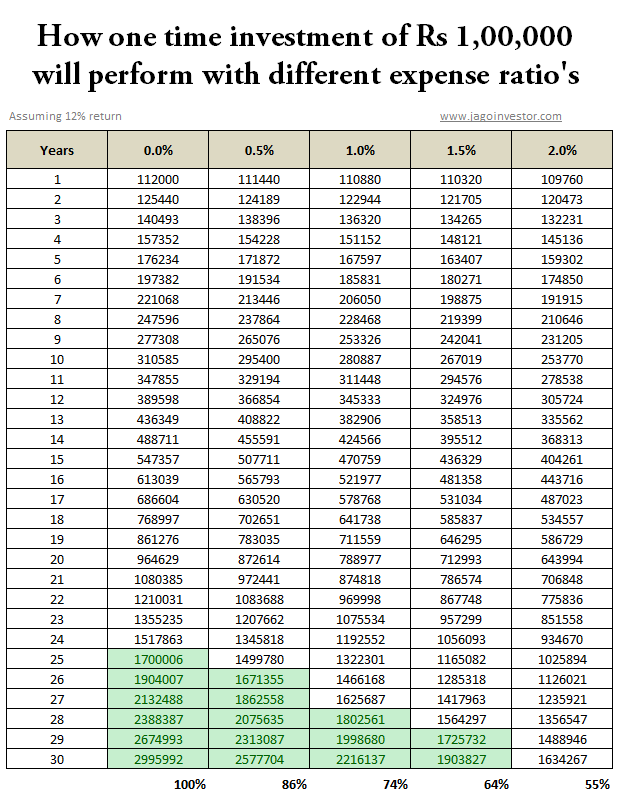
Suppose there was a mutual fund called “Jagoinvestor-Ninja Fund” (attractive name haan!) which generates a 12% return before expense ratio. Now let’s see how this fund final returns will turn out to be in different expense ratio scenarios like 2% , 1.5% , 1% ,0.5% and 0% (imaginary) . Expense Ratio Mutual Funds

Did you see that? How same funds performance can lead to huge a huge difference depending on expense ratio. In a longer term, you can see how the corpus value reached 29.9 lacs without any expense ratio, but if the expense ratio was 2%, then despite the same performance, the corpus would be reduced to only 16.3 lacs. That’s huge deficit of 45% compared to original corpus. While it’s a little unrealistic to consider 0% expense ratio, because it’s not possible in real life. Let’s see the different between 1% and 2% expense ratio. You can see that with 1% expense ratio the corpus was 22 lacs and with 2%, it was 16 lacs, that’s again huge 20% difference.

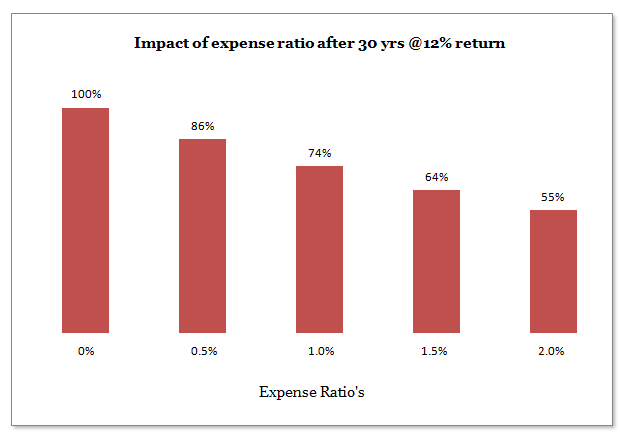
Also if you see the chart above, you can see a greed part showcasing how low expense ratio cases achieved the same corpus few years early than the high expense ratio scenario. You can see that with 0.5% expense ratio, 16 lacs was the corpus in 26th year itself which took 30 yrs in case of 2% expense ratio. In the chart below you can see how much the difference in different scenario’s final corpus percentage wise was.

Expense Ratio Mutual Funds

Remember that when you compare returns of mutual funds in long run (video), the calculations are shown after-expenses; hence it might happen that a better fund today is better in returns because its expense ratio was lower than the other one. It might happen that two funds differ in returns to some extent, but don’t vary too much when it comes to their ability to generate returns before the expenses. Naturally the mutual funds which have lower expenses would have better return at the end.

Case Study – HDFC Tax Saver vs Canara Robeco Equity Tax Saver

If you look at Valueresearch website, it has given Canara Robeco Equity Taxsaver fund a 5 star rating, but HDFC Tax saver gets just a 4 star. If you look at both these funds history, both the funds are 15 yrs old funds and if you look at short-term performance of both the funds, you will see how Canara Robeco is doing equally good or better than HDFC Tax Saver. But if you look at long-term performance of both the funds, you will notice a big difference.

While HDFC Taxsaver stands with tall chest giving 31% annual return, Canara Robeco seems to stare the earth with just 20% annual return. Now there can be a lot of reasons for this, but if you look at expense ratio, Canara Robeco has as high as 2.49% expense ratio, where as HDFC tax saver has just 1.91% expense ratio. So it might happen that Canara Robeco these days has to perform better than HDFC Tax saver before expense ratio and only then it’s able to sustain the performance.

As per a small study by moneylife, this phenomenon is true across the category , here are the excerpts : –

Consider the performance of 43 equity diversified funds which have been in existence before 2000. We chose 2000 because we wanted to gauge decadal performance of the funds. Of these 43, we selected the 15 most expensive funds and 15 cheapest. Among the expensive lot, we have only seven outperformers and eight underperformers. Whilst among the cheap funds, we have 12 outperformers and only three underperformers. It is not that the expensive funds have not earned good returns, but a part of their returns has been washed away by their high expense ratio.

For instance, Birla Sun Life Advantage Fund, which is one of the costliest and was launched in February 1995, has given a return of 19% beating its benchmark, BSE Sensex, by a margin of 8%. Reliance Growth, launched in October 1995 (seven months later), has given a return of 28% beating its benchmark, BSE 100, by a huge 16%. Was it the pure stock-picking skill of Reliance? Maybe. But the fact is the Birla Fund has an expense ratio of 2.31% and Reliance Growth Fund has an expense ratio of just 1.79%.

Conclusion

High expense ratio will hurt you in long run, so incase you are choosing two similar looking and similar performing financial products, you should look at their cost structure.

Can you share what you took from this article and how you will apply in your financial life?

Which Banks have highest Fixed Deposits interest rates ?

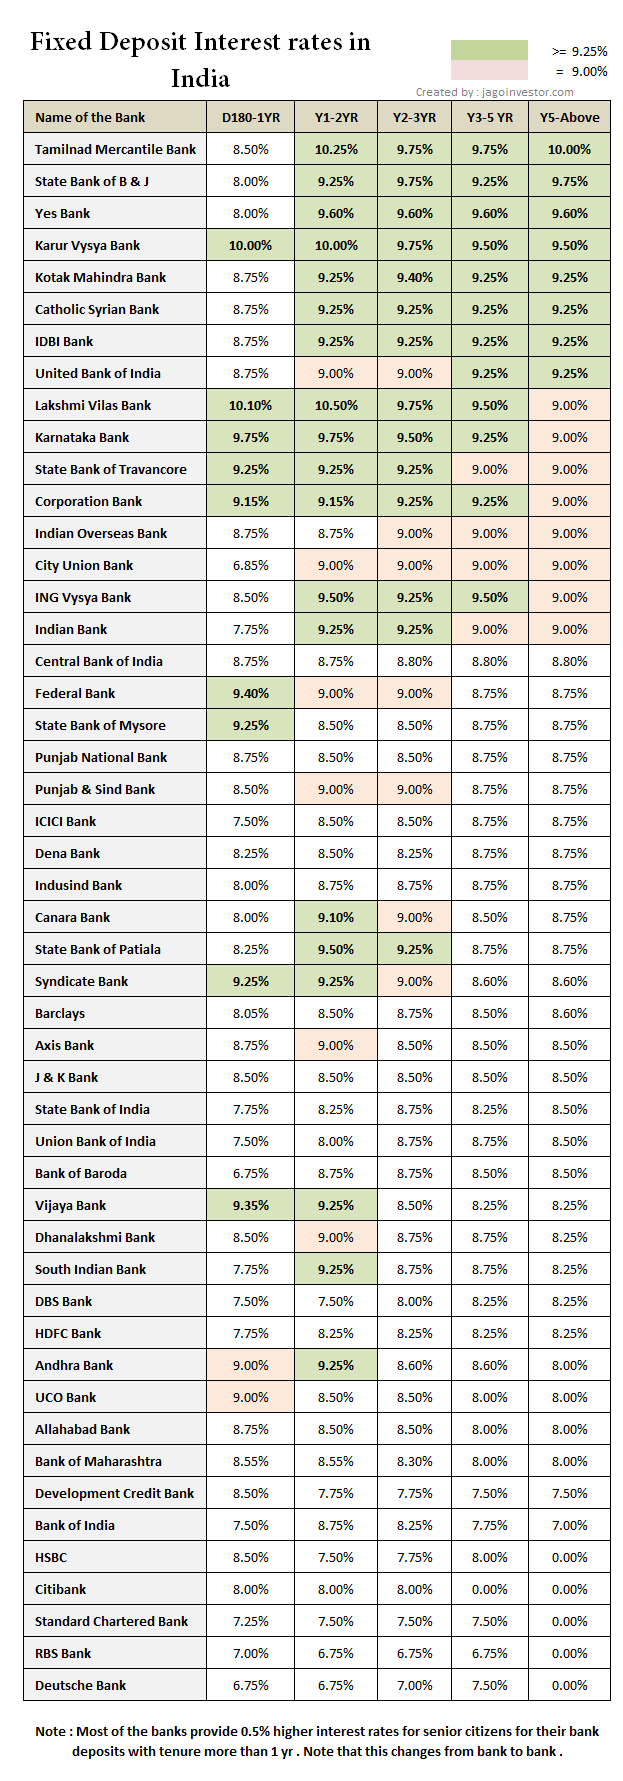
Do you know which bank in india has the highest fixed deposits interest rates ? But before that, let me ask you – Do you know what is the interest rate of your Fixed Deposit ? If it was opened a few years back, all you would have got is around 6-8% depending on the bank and tenure. But today its a different scene! . Fixed deposits interest rates are high these days and you can observe one of the other bank announcing fixed deposits interest rates revised each month and in range of 9-10% . I will show you a snapshot of various banks Fixed deposit interest rates with varying tenures.

For simplicity purpose, I have not included tenures of less than 6 months . See the graph below . Green color represents interest rates higher than or equal to 9.25% . Pink represents exact 9% . The banks mentioned in the table below are Tamilnad Mercantile Bank, State Bank of Bikaner and Jaipur, Yes Bank, Karur Vysya Bank, Kotak Mahindra Bank, Catholic Syrian Bank, IDBI Bank, United Bank of India, Lakshmi Vilas Bank, Karnataka Bank, State Bank of Travancore, Corporation Bank, Indian Overseas Bank, City Union Bank, ING Vysya Bank, Indian Bank, Central Bank of India, Federal Bank, State Bank of Mysore, Punjab National Bank, Punjab & Sind Bank, ICICI Bank, Dena Bank, Indusind Bank, Canara Bank, State Bank of Patiala, Syndicate Bank, Barclays, Axis Bank, J & K Bank, State Bank of India (SBI), Union Bank of India, Bank of Baroda, Vijaya Bank, Dhanalakshmi Bank, South Indian Bank, DBS Bank, HDFC Bank, Andhra Bank, UCO Bank, Allahabad Bank, Bank of Maharashtra, Development Credit Bank, Bank of India, HSBC, Citibank , tandard Chartered Bank , RBS Bank and Deutsche Bank . Look at the table below for the indicative interest rates for different tenures.

Fixed Deposit Interest rates in India

Note that a lot of banks offer high interest rates for special tenures like 500 days, or 555 days or 1000 days, but they have some restrictions which people dont know – some of them are

  • Some banks have provision, if rates increased in future, you can not apply for extention at higher rate of interest, instead you have to close that account and apply for new one.
  • Automatic renew not possible.
  • Upon maturity, you will not be able to get overdue interest.
  • Sometimes, you cannot premature close the deposit. however, these conditions vary from bank-to-bank.

Thanks to Lokesh for this information

High level Observations

There are some patterns we can see in area of fixed deposits . here they are

  • Fixed deposits with high interest rates for almost all the tenures are not the heavyweight banks, but the new generation banks, they are Tamil Nad Mercantile Bank, Karur Vyasa Bank, Kotak Mahindra Bank, Lakshmi Vilas Bank and others
  • Most of the banks provide 0.5% higher interest rates for senior citizens if the tenure is more than 1 yr . But if tenure if lower than 1 yr, the interest rates are same for senior citizens also . This is widely true , but some banks like Axis bank , SBI bank , ICICI Bank and HDFC Banks gives 1% higher interest to senior citizens.
  • Most of the foreign banks like Citibank, RBS , Standard Chartered has low-interest rates in range 6-7.5% . This is unattractive during these times when other banks are giving higher rates .

Low and Medium risk appetite investors can cheer

For investors how find themselves not too comfortable with equity and for those who want to park their money for few years without taking any risk and earning some good return in range of 9-10% , Fixed deposits are very good options.

The only point is if you are in high tax bracket, most of the returns will go in tax, but for investors who are in lower tax bracket of 10% or below the permissible limits , they can look for these options without much thought . These fixed deposits were for the year 2011 , but for most part of 2012 also these bank fixed deposits interest rates will be applicable .

How stock scams works in India

I will teach you how stock scams work today and for that Let me declare something – “After years of study and hard work, I have come up with a strategy which can predict stock markets movement with almost 100% accuracy. Each month I can tell you which way market will move in next 30 days, it can be UP or DOWN and I can guarantee that. If someone needs to see the performance, I can give a free 6 tips trial.” Now what will be someone’s reaction on hearing this? Most probably, some of you will get excited and interested in getting these free tips, at least to check if I am saying truth or not! . Right now I have a big subscriber base with more than 10,000 people (11.5k to be precise) whom I can reach by email. Let’s see how I can create a stock tip scam –

Stock Scam

Here is how we will build a scenario wherein you are Ajay who is extremely interested in knowing about the tops which are almost 100% accurate. Ajay is bearing some disbelief in his mind, but due to the trust factor in the given tips he thinks ‘Let’s see what tips Manish gives, they are free anyway and by reading his tips I am not losing anything’.

I start sending you exactly one tip each month and it starts this way:

Tip #1 (May) : Markets are headed UP

Reaction  : Markets really went UP in the month of May. Ajay feels good, but still he is confused if its just luck or did It really went up based on my tip . Ajay anyways wanted to just check the tip and how it turns out . He is a bit impressed and he has made up his mind to act upon the tips if 3 consecutive tips work.

Tip #2 (June) : Markets are headed UP

Reaction  : Markets after a bit of volatility finally went up and the tip was a success again! Markets are up by great extent, but Ajay feels like a fool to be so fearful and not act on it. But his confidence has started building up. If the next tip also works, Ajay will invest some money for sure based on the tip!

Tip #3 (July) : Markets are headed DOWN

Reaction : Crash! A huge sell off came in the month of July and the 3rd tip in a row was correct. Ajay starts feeling “Oh my god! Looks like Manish really have come up with something amazing which can predict markets” Ajay makes up his mind to “try” next 3 tips and see how it performs!

Tip #4 (Aug) : Markets are headed UP

Reaction : With all the excitement, Ajay has invested Rs 10,000 in the markets to see if he can make some quick bucks! However, Markets are headed down in the starting of the month and all the TV channels are confirming that next Crash is on the way. Ajay is a bit nervous and secretly praying for the tip to work somehow. He wants market to go UP as per the tip. Everybody around him has already sold off and decided to sell of all the stocks, but you are on the other side. You are praying, literally! And here it comes, markets make a turn up side and it makes one of the sharpest come back in 1 week. Ajay is now in profit and he feels like a winner. Ajay’s confidence in my tips is becoming stronger, but still he is not ready to take BIG risks, he needs to solid confirmation that the tips will fall true no matter what, which is about to come .He will invest 40k in the next tip of mine.

Tip #5 (Sept) : Markets are headed DOWN

Reaction :  Ajay thinks that he should liquidate all the investments in direct stocks and even his mutual funds. His friends do not think alike and suggest him that he should not go with the tip, but Ajay wants to confirm the tips and wants to see the affect on his investments in real time 🙂 Markets move downside and he is now confirmed that there is really some kind of mega-research done by Manish to come up with the tips using his secret-strategy. Ajay can now visualize how he can become a millionaire soon by subscribing to the tips for next 1-2 yrs. He is just can’t wait for the last tip to show its magic!

Tip #6 (Oct) : Markets are headed DOWN

Reaction : Ajay is totally with the tips now and has decided to use this last one to make some quick bucks, he does some short selling and buys some puts options by finding out how to make money in falling markets. With his confidence in the free tips, he does not lose focus and waits for the tips to turn correct. Markets fall as per the tip and due to his decisions, Ajay has made some amazing money this time. He is clear that he wants these tips at any cost now!

Free tips are over now.

Free tips are over now .

Taking money from the targets – How Stock Scams unfold

Tips are over now, Ajay and many others like Ajay has experienced the amazing tips which really worked. They all get a mail after few days from me.

Hi, you might have already got 6 free tips from me each month, we give only one tip each month, but it’s bound to work. It’s based on our strategy which is based on years of research. If you want to continue getting the tips further. It would cost Rs 50,000 for 1 year subscription. You can expect the same accuracy like you saw in last 6 months.

Disclaimer: The tips are highly accurate and we make sure they are accurate, but we can’t promise it and can’t guarantee it legally. Risk is yours

Ajay is so much impressed with my tips performance and so much drowned in greed, that he subscribes to my offer and pays 2 lacs for the secret tips subscription. The tips start coming from next month. But there is some issue this time! . Somehow, not all the tips are working this time. Some tips work, some does not. It’s not at all accurate like it was before. In reality all the tips are just random tips and Ajay is totally frustrated. He has lost a lot of money because he invested big money each time, thinking it would work!

The truth is Ajay fall prey to a stock scam. Now let me share how all this works.

How this scam works

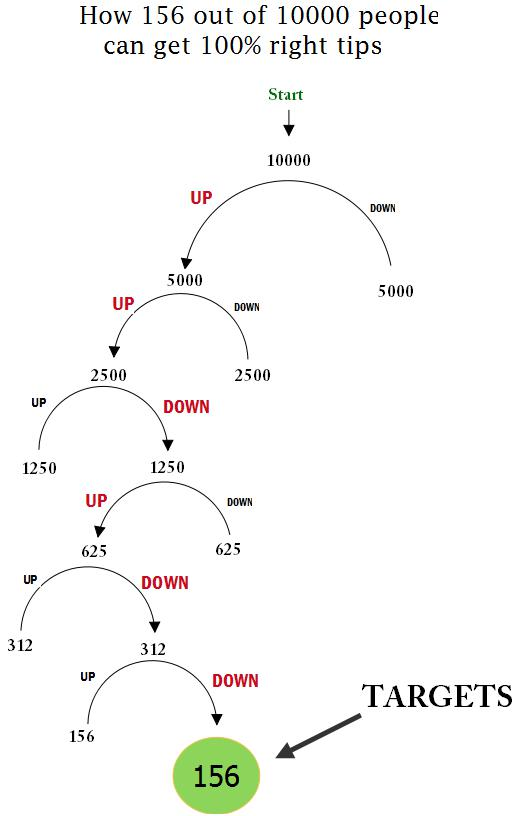
At this moment I have around 10k or more email subscribers and I can send emails to this 10,000 group. I divide this group of 10,000 readers into 2 parts A and B, I send a tip “BUY” to A group and tip “SELL” to B group. One of them will be true for sure. After month is over, I see which tip was correct. If A group was correct, I discard group B and only have people in group A as my final group. This group will be the group which got “correct” tip.

Now I do the same thing again, I divide them in group A and B with 2,500 members each and send “BUY” and “SELL” tip to them. Now again, markets will move UP or DOWN and one of those groups will be right at the end of the month. I again discard the group which got wrong tip. This way I continue doing it for 6 times and at the end I have small group of 156 people who was right all the 6 times and Ajay accidently belonged to his group.

How Tip Scam works

Targets paying for the subscription

Now you can imagine how many people will fall prey to these scams? Even if 20% of the people fall in the trap and are ready to pay Rs 50,00o, it would be Rs 10 lacs in total! Here you can clearly see that out of 10,000 there will always be a group of 156 people who will always get “accurate” tips and the beauty of this strategy is that people who were discarded only get one wrong tip, and after that wrong tip, they don’t get any more tips.

There are many tip providers in real life who claim to give you 90-95% accurate tips with free 1 week trial, If you are getting a lot of right tips, you might be that lucky small group which is their “TARGET” as seen above in the chart. Don’t fall prey to these stock scams. Beware!

Why HUL has become Hindu Unilever Ltd

Do you know of any stock in India which has not moved in last 10 yrs ? Hindustan Unilever is one of them ! . Successful investors like Warren Buffett always advocate the importance of investing in stocks for the long term and not just getting in and out of the stock. But more than investing and holding for a stock for the long term, it is important to zero down on the right stock. Or you might even hold a stock for more than ten years and still make very low returns.

Hindustan unilever

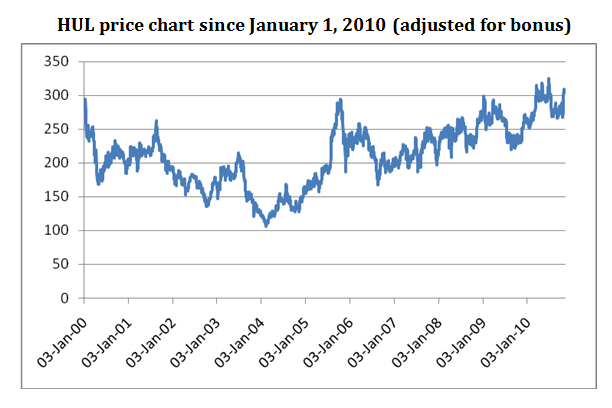
Let us take the example of Hindustan Unilever Ltd (HUL), a company which used to be the largest company as per market capitalization in India, at a certain point of time. But in the last 10 years the price of the HUL stock hasn’t gone anywhere. The stock price touched an all time high of Rs 314.123(adjusted for bonus) on February 25, 2000. This price was never beaten until September 24, 2010, when the stock closed at Rs 314.65. On November 9,2010, the stock closed at an all time high of Rs 318.9. This price was again overtaken in early January (January 5,2011) when the stock closed at an all time high of Rs 325.65. Currently the stock is moving in the range of Rs 300-310.

So the point is that if you were a long term investor in HUL and had invested in the stock in Feb 2000, and held on diligently for 11 odd years, you would still not have made any money on the stock. What HUL tells us is that the buy and hold strategy may not always work.

HUL and the Hindu rate of growth

Raj Krishna, an economist, coined the expression “hindu” rate of growth, to express the slow rate of growth in socialist India, when India used to grow by around 3% every year. Krishna was not a great fan of the socialistic model of development being followed in Nehruvian India. He was a believer in free markets. So looking at this secular trend, year on year, and wanting to take a dig at Nehruvian socialism, which he felt was not working, he came up with an antonym for the word secular (Nehru’s other pet peeve), and so called this growth, the “hindu” rate of growth.

HUL has signified this “hindu-rate” of growth over the last decade. Let us look at some numbers here. The annual sales growth of HUL over the last decade sales have risen at the rate of 6.2% every year to Rs 19,987.1 crore.  Profits have grown even slower at the rate of 5.8% every year to Rs 2306.6 crore.

The does not inspire confidence among investors, given that the rate of inflation during that period was at similar levels. So in real terms there has been very little or even no growth in profits and sales. Hence the stock price has been flat.

The main business is facing tremendous competition

Soaps and detergents has been the main stay of the company over the years, and still contributes nearly 75% of the revenues. The company has very little pricing power in this category, given the increased competition that it has been facing. With a slowdown hitting United States, P&G has become aggressive in India. Media reports suggest that P&G is looking to launch its toothpaste brand Crest in India. That should heat up things for Close Up, HUL’s premier toothpaste brand. The cash rich ITC is gradually building businesses similar to that of HUL.

Over and above that there are newer players like Ghadi detergent and older players like Nirma in the lower segment of the market, which have been giving HUL a huge run for its money. To counter this competition HUL  has had to constantly resort to price cuts to keep the revenues going in this segment. This is likely to continue in the days to come leading to a very limited pricing power in its premier business. At the same time it needs to keep its advertising expenses high in order to generate a high brand awareness of its products and hope of increasing sales.

New Businesses not contributing enough

During its glory days, HUL’s strategy was to constantly jack up margins. The management graduates who run the company probably forgot a basic lesson in economics. When a company makes ‘abnormal profits’, new competitors enter the arena and drive away margins.

The margins also came from deteriorating the quality of their products.  What did not help was the power brand strategy the company decided to follow 10 years back, where in the focus was on 30 odd ‘Power Brands’. The ‘power brand’ strategy prompted HUL to withdraw from a large number of small markets. This has given an opportunity to many small players in the market. Some of these brands like Ghadi detergent are now seriously challenging HUL.

To its credit the company has tried to get into new businesses like selling water filters (Pureit). But these businesses will still take sometime to grow. Also the competition in this market has started to heat up with Tatas announcing their entry with Swach.

What do the analysts say?

HUL recently declared its results for the quarter ending March 31, 2011. While it managed to increase sales by around 14% to Rs 5,022.6 crore. But even with this increase in sales the net profit went down by 2.1% to Rs 569.2 crore.  Analysts covering the company came out with reports saying that the results beat their expectations, which is basically a polite way of saying that results were not as bad as we expected them to be.

Given these reasons, those investors who are still invested in HUL, its time they sold out.  This stocks is an excellent example of what John Maynard Keynes, the famous economist, said a long time back, “in the long run we are all dead”.

This is a guest post by Sujata Chhaper and the author can be reached at [email protected]

What are different sectors in stock market

Which one among Reality sector and Banking sector has given more returns in last 5 yrs and 10 yrs with lump sum and SIP way of investing ? Have you ever tried to find out which sectors among indian indices are doing well and which are not ? In this data-oriented article will take you into the world of different sectoral indexes on Nifty, like Bank Nifty , CNX IT , CNX Pharma , NCX FMCG and some more like those . We will see their performances compared with each other with graphs. Note that I have also taken NIFTY as one of the index to compare it with a broader index even though it’s not a sector specific .

Which sectors ?

In this study you will come to know about lump sum and SIP performance of various sectors for 5 yrs and 10 yrs time frame. I have taken the raw data from NSE website and done all the number crunching and graphing to come out with charts which shows you how money has grown in various sectors . I have taken 6 sectors ( Nifty , Bank Nifty , Energy , Pharma , FMCG) for 10 yrs time frame and 8 sectors for 5 yrs time frame (6 mentioned earlier + Reality + Infra ) .  We will see the results of 4 different scenarios and will see major learnings from those .

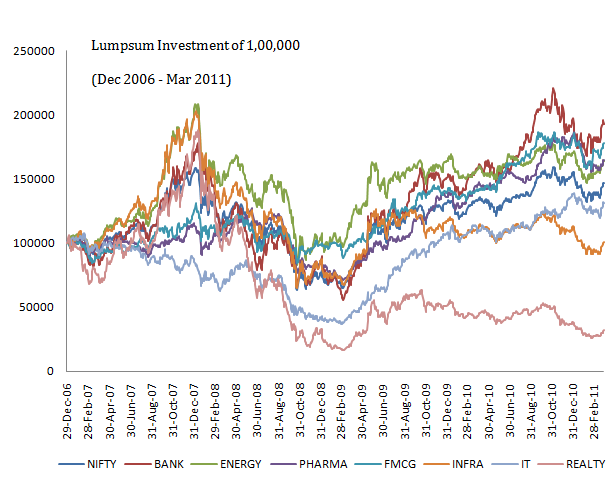
10 yrs performance [Lumpsum Investment]

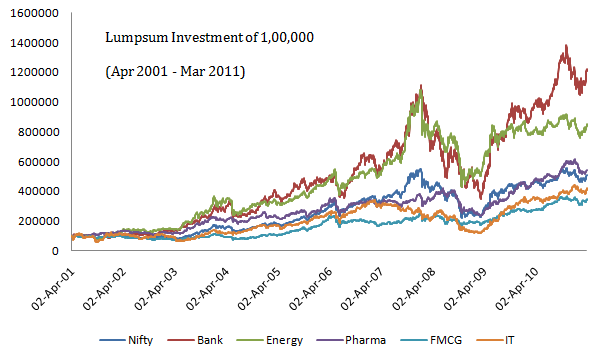
The chart below shows the sectoral performance + Nifty for a lump sum investment of Rs 1 lac in last 10 yrs  .

 different sectors in stock market

Observations

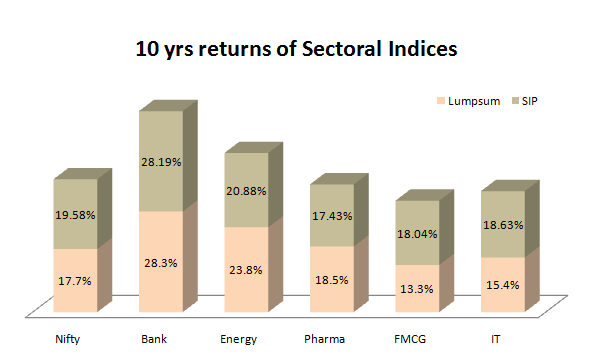
  • Bank Nifty was the clear out performer among all giving a 12x return in just 10 yrs . That’s very good return . Energy sector came second and FMCG and IT sector gave the least returns out of all .
  • Bank Nifty has given 3x return after the crash of 2008-09 . Look at the big spike upwards . Till the crash Energy sector was performing same to same as Bank Nifty , but after the crash, performance of Energy sector deteriorated and it didn’t match up with Bank Nifty.

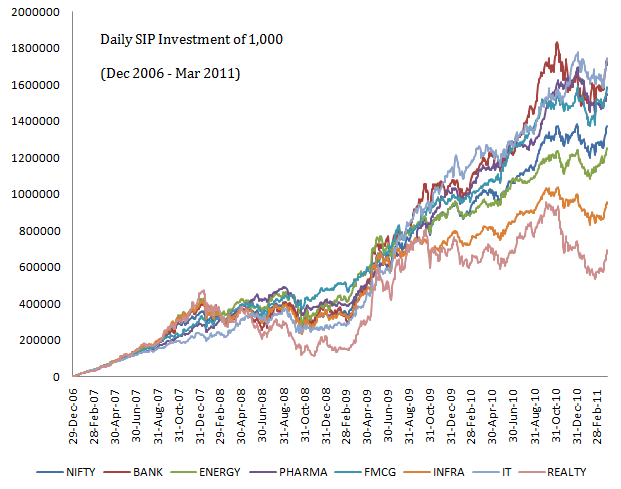
10 yrs performance [Daily SIP Investment]

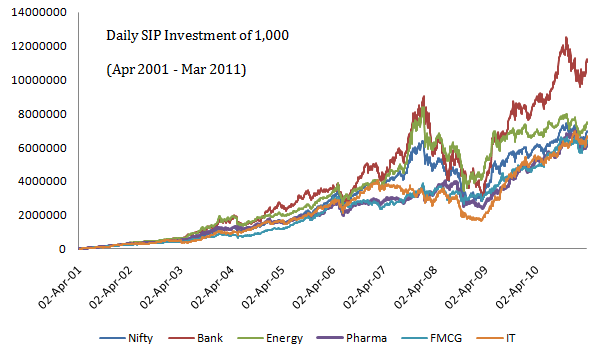
The chart below shows the sectoral performance + Nifty for a daily SIP investment of Rs 1,000 in last 10 yrs  .

SIP Sectoral performance 10 yrs

Observations

  • The most insight full thing you can see here is that all the sectors other than Bank Nifty has given very close return if one had done SIP regularly . This shows both, the power and weakness of SIP . You can get more returns out of bad sector and less return from the strong sector .
  • IT sector performed very badly after the crash , but in the recent bull run , it has performed very well and gave superior upside .

10 yrs CAGR returns for lump sum and SIP investments

The following chart gives you CAGR return of last 10 yrs for both lump sum and SIP . Note that the values are approx only .

SIP and lumpsum returns of Sectoral indices in 10 yrs

5 yrs performance [Lumpsum Investment]

Now we will look at 5 yrs performance of various indices . The chart below shows the sectoral performance + Nifty for a lump sum investment of Rs 1 lac in last 5 yrs  .

Lumpsum Sectoral performance 5 yrs

Observations

  • Bank Nifty still leads the pack , the other sectors too performed good and are marginally poor . Nifty , Pharma and Energy come next best .
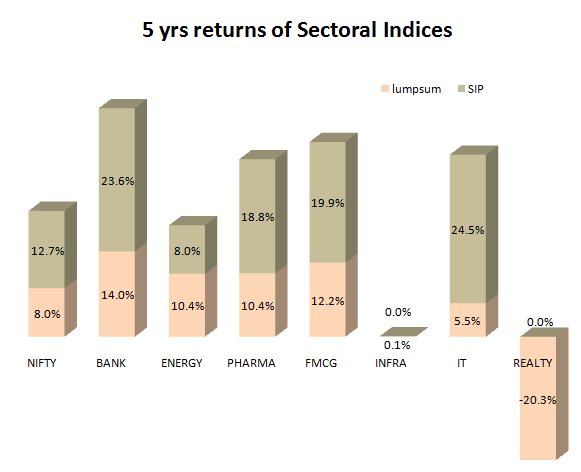
  • Reality sector was one of the best performers till 2007 , but then its performance went down and its gave a very high negative return on CAGR basis . When other indices gave above 10% returns on average, Reality index averaged -20% CAGR return .
  • Energy index has not made much movement in last 2 yrs from 2009 – 2011 , whereas Bank Nifty has doubled .

5 yrs performance [Daily SIP Investment]

SIP Sectoral performance 5 yrs

Observations

  • On 5 yrs SIP basis , IT sector has clearly outperformed other sectors and it was very consistent in that . Bank Nifty comes second.
  • Reality and Infra sector has performed badly and given close to ZERO return in last 5 yrs .

5 yrs CAGR returns for lump sum and SIP investments

The following chart gives you CAGR return of last 5 yrs for both lump sum and SIP . Note that the values are approx only .

SIP and lumpsum returns of Sectoral indices in 5 yrs

Please share what other information were looking from an article like this . Share your comments about the article .

How did you like the information ?

Silver prices vs Gold Prices in India

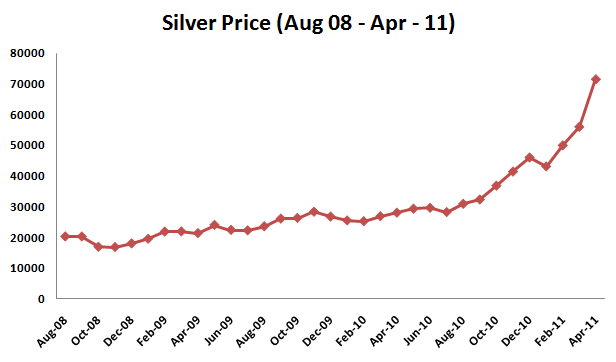
Imagined what gave maximum return in 2011 or 2010? Well, was it Gold, Equity or Real estate? Nope! Hold your breath, it was SILVER and it gave huge returns! It is almost unbelievable that the price of silver as on Aug 2008 was around Rs. 20,000/ Kg, and it went to Rs. 72,000 by the end of Apr 2011, which was a 300% absolute rise in less than 3 yrs. But don’t get too excited, Silver in just 1 week has fallen like anything. From the peak of 72,000 in Apr 2011 end, it went down to Rs 52,000 in just 1 week. Can you believe that? A 28% fall in the prices of silver in just 7 days! Let’s explore more on this.

Silver prices vs Gold Prices in India

Gold vs Silver returns ?

Now a days there is a big debate going on different TV channels as well as newspapers that what should a common man buy? Gold or Silver?

In our country, Gold is something which every family buys because of the attraction we have for this metal. On any occasion, gold is the obvious choice. But Silver is not seen the way gold is looked upon. It’s generally limited to not so well off section of the society. This is one of the reasons why middle class or even richer one’s never considered looking at what’s happening in silver and if it can have some potential in future as an investment option. Gold, Gold and Gold was the only option when it came to buying some precious metal.

A lot of people are surprised to hear and see how gold has given fabulous returns year on year in the last decade, but now you would be more surprised to know that for most of the years silver has outperformed gold with good margins in terms of returns. For example, everybody knows that Gold gave 25% return in 2010, but not many know that Silver in the same year gave 80-85% return.

Silver has given 24% absolute return in just one month of April 2011. I don’t think it’s anything other than speculation because that rise was short-lived and in just 1 week (May-‘11 first week), all the gains made in Apr disappeared and prices fell by 25%.

Below is the chart which shows you the monthly price movement in silver for last 30 months. You can see how silver prices exploded in last 4-5 months (2011)

Silver Price in India

Factors affecting price of gold and silver

1 . Supply and Demand

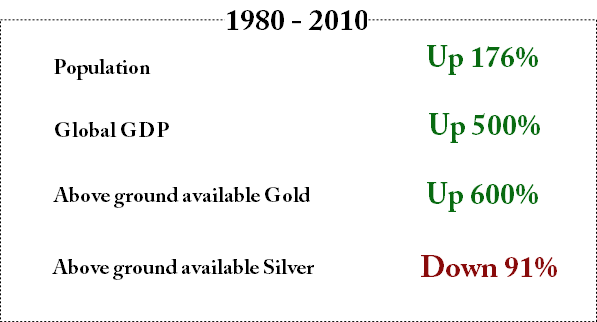
One of the biggest and obvious reasons behind the price movement for anything is its demand and supply in the market. It directly impacts the movement in price. It is estimated that in 1950, the reserves of gold was 1 billion ounces, but by 2010 it increased by 700% to 7 bullion ounces (see the video below)

However on the other hand it is totally different with Silver, in 1950s there were 10 billion ounces of silver, but by 2010, it dropped by huge 95% and its current reserves are only 500 million ounces worldwide. A very obvious reason for this is that gold is mainly stored in form of bars, jewellery etc and its recycled again if required. However silver is also used widely in Industry in very smaller and thin parts which get lost and never reused. In fact, it is not possible to use it again because of its used in lesser quantity and in small parts.

Gold and Silver

2. Practical use in life

Gold and Silver are very different when it comes to its usage in real life. While both of them are precious metal and often used as jewellery, Gold has a very different image and can be considered as the undisputed king in this area. From millenniums Gold stands the most favourite metal for jewellery, in fact there is some kind of unseen connection which humans have with gold, which cannot be explained. May be it’s the way it has always been and it can’t be changed. But if you see gold as a useful metal, it does not have much to show off. It’s literally not used anywhere other than at a few places.

Silver on the other hand is also used in various industries and holds a very important position. In fact you can see it as “gold” for industrial use. Let me give you more info on this. Silver is used in Bandages, batteries, soldering process, cell phones, computers, satellites, high-tech weapons, laser and digital technology, electronics circuit board, solar cells, water purification, RFID chips and the list goes on.

Silver has more industrial applications than any other metal. A recent report by Hinde Capital says: “It’s the best conductor of both heat and electricity, the most reflective, and second-most ductile and malleable element, after gold.” The white metal is also being put to several new uses like-water purification, air-handling systems and a natural biocide.”

In last couple of decades, Silver is so extensively used in Industry that it’s reserves has drastically gone down. Just to give you an example, in the decade of 1990 – 2000, around 2 billion ounces of Silver was consumed. That’s a lot of silver!

3. Role as alternate currency

Precious metals are always considered as the alternate currency and wealth in pure form in any emergency situation. Gold is a universal currency and not dependent on country or any community.

In times of war, people fear that their assets may be seized and that the currency may become worthless. They see gold as a solid asset which will always buy them food or transportation. Thus in times of great uncertainty, particularly when war is feared, the demand for gold rises. That’s exactly what happened in Zimbabwe lately, where currency is worthless now and people are using gold as alternate currency to buy bread

Recent rise in Silver Prices

You might have heard lately about rise in Silver prices and definitely you might have felt that you “missed the bus”. Let me talk a bit on that. You have already read about the reasons of price rise in silver above. One of the biggest reasons is fundamentals of silver, it is a valuable asset and over a long-term, it’s going to be much valuable because of its use in industry, every industry requires silver!

But other than fundamentals, there are elements of speculation also involved, otherwise I don’t see any reason for 150% rise in its prices in just 1 yr and then a 25% fall in just 1 week. It’s going to be volatile.

To know why the price of silver fell recently , read this article . Please share your comments on Gold and Silver as an investment .

How RBI rate hike impacts your financial life ?

Few days back, there were some changes announced in repo rate and saving bank account interest rates by RBI. Do you want to know how you as an investor would get impacted with the recent changes done in interest rates by RBI? I have seen that a common man always ignores this kind of news because it looks too complicated to him or he can’t understand how his life will be affected by such fluctuations. In this article, I will touch two most important changes that were recently disclosed by RBI and show you in simple manner how it’s directly related to a common man. Note that this article is limited in its scope by looking at the two changes from the point of view of its direct impact on a common man.

Interest rate hike by RBI

Let me quickly go through two main changes which RBI recently changed and explain to you how it impacts common man. Note that this article is limited in its scope of looking at these two changes only from a viewpoint of how a common man is affected directly.

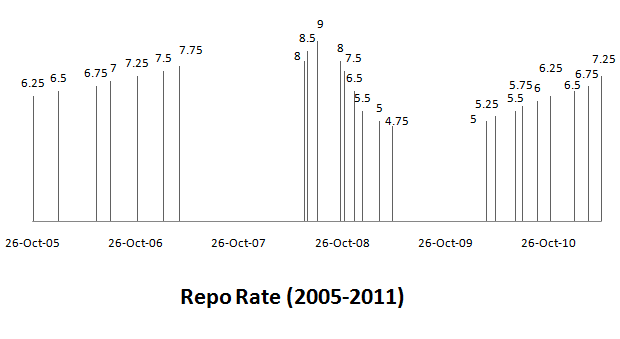
1. Increase in Repo Rate by 0.5% (6.75% to 7.25%)

Repo rate is a rate at which Bank borrows money from RBI, which was increased by 0.5% by RBI and is at 7.25% right now. So now what are the effects of it on a common man? Let’s understand this concept. Banks offer loans like Home loans and Auto loans to someone at an interest rate which is directly proportional to Repo rate (interest rate for common man = repo rate + X %). Now change in repo rate has a direct impact in the interest rates offered to customers for loans by the same or by more magnitude.

Now with the increase of 0.5% in repo rate, this increase will directly be passed to a common man (in case of floating interest rates). In fact some banks like IDBI bank and Yes Bank have already increased their interest rate for loan takers. In fact, Chanda Kochar (Managing Director of ICICI Bank) has already said that this repo rate increase can increase the interest rates for end consumers in the range of 0.5% – 1.0%. So if your interest rate for home loan or Auto loan was 10% p.a, it will now increase to 10.50% at least. This has direct impact on the EMI which you pay for your house.

Let’s see the calculations. If you had bought a house worth 30 lacs @10% interest, 15 yrs tenure, then the EMI would be Rs 32,238. With an increase of 0.5% in interest (10.5%), your EMI will rise to Rs 33,162. That’s an increase of Rs 924 on every EMI. However if the interest rates rise by 1%, in that case your EMI will increase by Rs. 1,860 (calculate yourself). Now imagine if you took the loan at the time of low-interest rates and over the years the interest rates keep rising every quarter, your EMI can shoot up so much that it would make your cash flow very uncomfortable. For example, just last year in Mar 2010, the repo rate was 5%, and then RBI increased it up to 7.25% today. This means there was a 2.25% increase in the last 14 months. You can understand the impact of this on EMI rise over the last 1 yr!

Hence, now you understood how change in repo rate directly impacts a common man, because that change in repo rate is passed on to common man and his EMI’s are affected in the case, the person has opted for floating interest rate option while taking the loan.

Interest rate hike by RBI

2. Increase of saving bank interest from 3.5% to 4% .

The second change which RBI has done is to increase the saving bank interest rate. Till now it was 3.50% which was set long back, many years ago and was never revised. But finally with this year’s credit policy, RBI increases it to 4%. Now you must be thinking how does this impact common man? It’s a good thing for account holders.

Well, in a way it’s a good thing that a person will get higher interest rate on his cash lying in the saving bank account, but let’s see how it impacts a bank. A bank that was paying 3.50% interest on the money will now have to pay 4% interest. That means now, it would directly impact Bank’s profitability. Suddenly a bank which was able to add up that 0.5% interest in its profits has to pay it to customers and that would hit their margins. Bank’s profits will come down by that much amount. This is not a good thing for the bank. That’s a simple reason why you should have expected a big fall in banking stocks and that’s exactly what has happened on the day when this news came in that saving account interest has been raised.

Banking and automobile stocks anchored the broad-based selling. While the hike in saving rates is expected to hit the net income margins of the banks; muted sales numbers in April, high fuel prices, and likely rise in auto loan, diminishing outlook for automobile space.

Among banking stocks, Bank of India, PNB, SBI and Yes Bank tumbled 6.47 per cent, 5.07 per cent, 4.03 per cent and 4.03 per cent, respectively. ICICI Bank and HDFC Bank dropped 2.76 per cent and 2.40 per cent.

Note that around 22% of the money in banking system lies in normal savings bank account and that’s approximately 10 lakhs crore in all the banks. Taking a hit of 0.5% on that kind of money is Rs 5,000 crore. That’s a direct impact of the bank margin of profits. The worst affected will be those banks where saving account ratio (the amount of money lying in bank accounts vs. total money with bank in all forms) is very high. Clearly banks like ICICI bank, SBI bank, Punjab National and HDFC banks are the names I can think because their saving bank deposits stand in range of 30-35%, much higher than the average of 20% across all other banks.

Now how does this impact the common man? Again this move of increasing the interest rates for saving bank is going to affect banks profitability and banks are going to pass this burden to those people who take loans from them, which means those who only put money in bank will stand to gain and the people who took loan will be losing out.

S Raman, cha­irman and managing director of Canara Bank, said, “There was a need to increase savings bank rate. It will lead of cost of funds going up but how much will it affect the margins of banks will depend on the extent of pass through of these rate hikes to consum­ers in terms of len­ding rates. Le­n­ding rates can go up by 50-75 basis points.”

Conclusion

Repo rate fluctuations which come from Banks in the form of increased interest rate for loans will directly impact common man. Knowing this can help an investor in many ways. The biggest benefit a person can from such fluctuations is if he time’s his decisions based on where the interest rates are inclined towards.

Let me know what do you think about this rate hike in repo rate and how is it going to impact your life?

Balanced Funds Performance – HDFC Prudence vs HDFC Top 200

Have there been times when you thought of investing in Balanced funds like HDFC Prudence, but did not invest because you wanted to invest in pure equity funds with maximum exposure to equity? If yes, than you need to rethink this thought because balanced funds have performed superior than equity funds in some cases and given their diluted exposure to equity as compared to that of a pure equity fund, the returns are really worth considering. So here you go-

What are Balanced Funds ?

Balanced funds are Equity Mutual funds, which are not as aggressive and as pure equity diversified mutual funds and keep equity component in the range of 60%-75% and rest in Debt products or Cash. By definition you can see that Balanced funds are not exposed to equity in the same way as regular equity diversified funds whose equity exposure is generally 95% or more in an average scenario. Balanced funds keep a balance between equity and debt, with equity still being the higher component.

For example, HDFC Prudence keeps its equity allocation around 75% in most of the cases and rest 25% in debt or cash. However, Reliance Regular Savings Balanced is generally low on equity and keeps it around 60-65%, but from last some months, it has raised its equity exposure to 70%, but hasn’t touched its limit of 75% ever! . From tax point of view, any mutual fund which has equity component more than 65% is considered as “Equity Fund” and long term capital gains are exempted from tax after one year just like an pure equity equity fund .

Balanced funds Returns less risky than Pure equity mutual funds

As balanced funds are lower on equity exposure, the fall in case of market crash is lower than pure diversified funds. For example, during the financial crisis of 2008, balanced funds lost only 42% as compared with 53% drop in returns by diversified equity funds.

Lets also see another example of Reliance Regular Saving Balanced fund, its NAV was around 17.27 on 1st Jan 2008, exactly after 1 yr on 1st Jan 2009, its NAV fell to 11.26 which is 34.78% drop, where one of the best diversified equity fund from Reliance AMC called Reliance Regular Saving NAV was 30.28 on 1st Jan 2008 and it dropped to 14.05, which is 53.6% drop. After that in next 2 yrs, Reliance Regular Balanced fund has given a return of 110% , where as Reliance Regular Saving Equity gave a 137% return, which shows that Pure equity fund gave much better return than balanced funds in 2 yrs time frame (Jan 2009- Jan 2011). But the most interesting thing is to look at the 3 yrs return starting from Jan 2008 to Jan 2011, which shows that the return of Reliance Regular Balanced fund was 137% where as the return of Reliance Regular Saving Equity was 110%, which shows that if you also consider the crash of 2008 into the overall scenario, Balanced fund out performed Pure equity fund by a considerable margin.

Comparision of Returns from Reliance Regular Saving Balanced and Reliance regular Saving Equity Funds

Balanced vs Equity funds Comparision

Main Advantage of  Balanced Funds

Balanced funds have to maintain their ratios of splitting between equity and debt by fixed percentage. In order to do so, the fund has to keep on buying and selling from time to time which leads to the concept of Asset Allocation. So, if a balanced fund has a ratio of 70:30 (Equity: Debt) and suppose it reached to 77:23, the fund manage will make sure that he sells the excess part of equity to rebalance the fund back to 70:30. However in equity funds, if the ratio itself was 98:2 earlier, despite the big run in markets, the equity part will still remain around the same ratio and there is no question of asset allocation.

So the conclusion is that the asset allocation is the internal advantage available to Balanced funds which leads to superior returns over longer term, but in short term, balanced funds will not out perform pure equity based funds incase there was a bull run. You always have to give balanced funds a long time to see the performance.

Performance of Balanced Funds vs Equity Funds

Can you imagine HDFC Prudence out-performing HDFC Top 200 despite having a low equity exposure compared to HDFC Top 200? Yes, it has happened! Now let me show you some statistics which I found out.

SIP investment in HDFC Top 200 vs HDFC Prudence

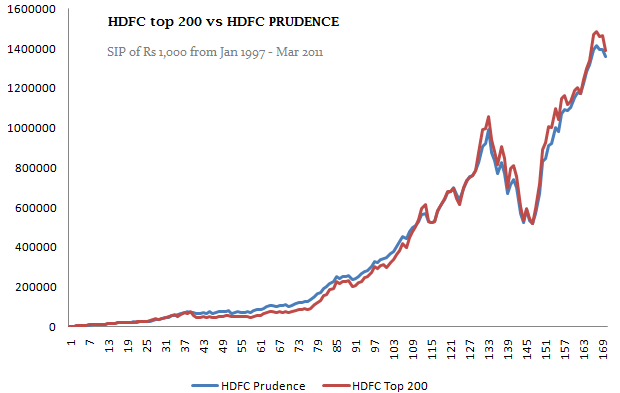
Over the last 14 yrs from Jan 1997 to Mar 2011, if you had done a SIP investment of Rs. 1,000 per month in HDFC Prudence, it would have become Rs 13.6 lacs and return turns out to be 25.93% CAGR. However if you had invested the same 1,000 per month in HDFC top 200, it would have become 13.9 lacs and return turns out to be 26.20% CAGR, marginally more … Which shows that despite having much lower equity exposure, HDFC Prudence has given almost equal returns like HDFC Top 200, which in my opinion can be called out-performance. Here is the chart of how the corpus was moving in both HDFC Prudence and HDFC top 200 for 14 yrs (SIP of Rs 1,000/month).

HDFC top 200 vs HDFC Prudence comparision

Lumpsum Investments in HDFC Top 200 vs HDFC Prudence

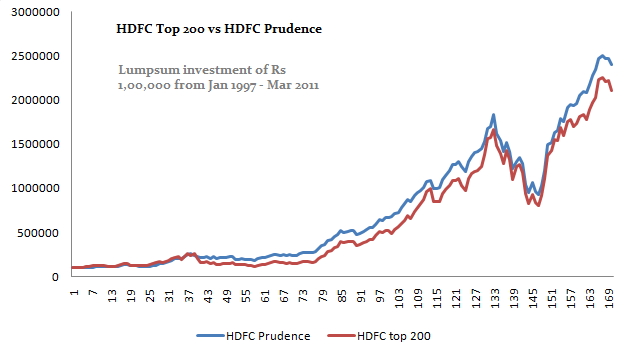
Now let’s come to lumpsum investment. Imagine you invested Rs 1 lac in HDFC Prudence on 1st Jan 1997 and I invest the same money in HDFC Top 200 on same date. We both redeem our investments on 11th Mar 2011. Who will have more money? Answer is it would be You, You will have around Rs 24 lacs (CAGR return = 24.94%), whereas I will have approx 21 lacs (CAGR return = 23.78%). See the chart below to look at how the corpus moved per month in case of one time lumpsum investment.

HDFC top 200 vs HDFC Prudence comparision

Some more statistics on Balanced Funds

  1. In the last 10 yrs , the return from HDFC Prudence is 29.38% . Only 2 Equity Diversified funds has outperformed HDFC Prudance in true sense, which are Reliance vision and HDFC Top 200
  2. HDFC Prudence 5 yrs returns is 17.93% cagr and its more than pure equity funds (The best return is from HDFC top 200 at 17.90%)
  3. HDFC Prudence returns have outperformed all the equity diversified equity funds in 3 yrs time frame, HDFC Prudence returns for 3 years is 18.65% and the best equity diversified funds in 3 yrs time frame was Mirae Asset India Opportunities Regular with returns of 17.88%
  4. The average of top 5 balanced funds return in last 5 yrs was 15.88% (17.93 , 16.97 , 15.54 , 14.55 , 14.40) and average of top 5 equity diversified funds was 16.63% (17.9 , 17.63 , 16.88 , 15.72 , 15)
  5. The average of top 10 equity diversified funds in last 10 yrs was 27.67% , balanced funds was 22.57%

List of good Balanced Mutual Funds

List of Balanced mutual Funds

Source of Data : All the data is taken from Valueresearch , and for growth category of mutual funds , not dividend , All data as on 19/04/2011 .

Do you invest in balanced funds ? What you think it would be wise to invest in balanced funds compared to pure equity funds ? Share your thoughts on this HDFC Prudence vs HDFC Top 200 comparision which must have shown you difference between equity funds and balanced funds