A Small tutorial on “How to start Trading?”

What does it takes to be successful in Trading ?

We are going to see 2 articles on this subject, this is Part 1. In this part I will give introduction to Trading and tell you what exactly is it and how should you approach it (if you want to do it).

Trading

Dr. Alexander Elder, explains in his legendary book “Come in to My Trading Room”, the 3 M’s of Successful trading, which I will touch upon today and will explain it in my own way to you. In the second part we will see the 3 M’s in my way of explanation.

Let us first see what exactly is the difference between Trading and Investing and then we will go over the explanation.

Difference between Investing and Trading

Investing means buying a stock of financial instrument for a long period of time, typically over several years. Assessing good investment opportunities often makes use of fundamental information, such as earnings, but can also use technical analysis to detect long-term trends.

Trading means buying and selling stocks or other financial instruments for shorter periods of time, typically less than a few months. Assessing good trading opportunities typically makes use of trading systems or chart-based techniques to detect short-term patterns.

The main advantage of trading over investing is that it provides the ability to make money regardless of the overall direction of the market or the price of an individual stock. The general consensus is that You can make more money in bear markets with Trading than Bull markets. Because bear markets provide steep movements compared to bull markets .

How Risky and Rewarding is Trading ?

Risk : Trading is considered as one of the most risky business you can ever do. Trading can wipe out your entire money so fast that you cant even imagine. As per the data, every 19 person out of 20 who does trading eventually looses. So the success ratio is not more than 5%, even out of this 5%, 3-4% just make small money, actually big money is made by 1% of people.

Reward : If done correctly and successfully trading can make you enough money you cant imagine. Most of the successful traders make more money in a month than people who are considered as “making good money” make in a year. but this numbers is for highly successful traders.

The other reward for successful trader is Independence. Once successful, you are your own boss, can work whenever you want, trade from all corner of the world while travelling.

For people who want to try there skills in trading can try mock trading on moneyvidya.com, Just buy and sell stocks and see how much money are you able to make in 2-3 months, It will give you some feel of trading. You can also read past my article on MoneyVidya.

Should you try Trading ?

Well, Just anyone who thinks that trading is a “get rich quick” thing, is doomed to failure, this is the biggest reason why people fail, they start or see trading with wrong attitude, they want to make millions (if not billions) in just a month or a year from Trading, They underestimate the Risk part and over estimate Reward part of Trading and eventually fall pray to Market’s anger.

Just because its “BUY” or “SELL”, they think its easy. and they need to read a little bit and because they are so successful and smart in whatever they are doing currently, they will succeed in Trading too. The approach Trading in a wrong way with totally unrealistic expectations.

So the main question still is “Is it for you ?”

you have to ask your self some of the questions which are as:

  • Are you ready to take Great risk of losing money ?
  • Do you have time and energy to learn the stuff required to Trading ?
  • Do you like Markets, numbers and what ever required for Trading ?

Some of the thing which “does not matter much” in Trading are :

  • Are you highly intelligent person ?
  • How successful you have always been in whatever you have done earlier in your life ?

Conclusion :

Understand very well that Trading is a very very risky business and not an easy thing , you have to learn it just like any other profession like Medicine or Software and it takes time . But , now a days I would say Trading is much easier compared to earlier days , Now with the online trading and lots of data available on Internet , there is lot of scope in Trading now .

In the next post we will quickly see 3 M’s for successful Trading . here is Part 2

Disclaimer : I am myself a student of Trading and still in my learning Phase , I have lost good money in Trading and still struggling to break even . But Eventually its going to happen, because I have not lost the confidence and still on fighting in the battlefield (Markets) .
 

Why you should Plan your Taxes at the start of the Year?

Most of the people take care of there 80C at the end of the year around Jan-Mar . Ideally it should be at the start of the year . Let us see why its should be done at the start of the year itself to plan your taxes.

Plan your Taxes

Following are the 4 most important reasons for Planning your Taxes in start of the year .

Easy on Pocket :

If you plan your taxes at the start of the year , you can then put small amount of money each month . Otherwise you will have to cough up all the money at the end of the year , which can be little difficult on the pocket .

For example :

If you want to invest 60k for this year … you have two choices , either plan your taxes in advance and invest 5k per month, or invest 60k at the end.

No Headache last moment: Another important point to consider is the tension and headache you go at the last moment because of the rush , there is sudden confusion at the end on what to take , where to go , where all the money will come from and all those things .

planning the taxes in the start of the year ensures that you do in correctly and without and headache for the last moment .

Correct products :

If you plan your taxes in the start of the year , you can do your research well and plan for products which you actually need and then go for it . I have seen most of the people taking all kind of wrong products which they don’t need, because there is just no time to think about your requirement , you just have to “invest to save tax” .

Conforms with principle of “Investing Early” : Also when you plan our taxes early you are putting your investments early, that way you are ahead of most of the other people .

Conclusion

An important aspect of Financial planning is to plan your taxes early . Why procrastinate when you know you have to do it anyways … Best of luck .

I have written a series of 4 articles which talks about “Buying Stocks Smartly”

You can read them here : Part 1, Part 2, Part 3 , Part 4

How to use Oscillators to BUY an SELL

Hi

This is 4th part of the “How to be a better than average Investor” series of articles. Today’s lesson is on Oscillators .

What are Oscillators :

Oscillators are the indicators which move from overbought to oversold area, generally from 0 to 100. when they are nearing 100 it means stocks are overbought and “expected” to go down now. when they are nearing 0, it means, stocks are in oversold area and fresh buying can come and move the stock up.

Oscillators

hey .. wait a min, did you vote on the poll upper right side, I have asked on what all topics do you want me to write. Please select topics from them, so that you also get to read your favorite thing some time 🙂 cheers … go ahead ..

I will discuss just 2 oscillators which Investors can use to make better BUY AND SELL decisions.

Let take a time frame of 6 months and see how indicators gave signals of buy and sell. We will see 2 indicators here RSI and Slow Stocastics (SS) (Read what is RSI and What is Slow Stocastic ).

Rules

When it’s overbought, we SELL the share.
When it’s oversold, we BUY the share.

SS BUY signal = when blue color line crosses down the Red line.
SS SELL signal = when blue color line crosses above the Red line.

RSI BUY signal = when RSI has moved below 30 and starts moving up.
RSI SELL signal = when RSI has moved above 70 and starts falling down.

To make signals more stronger, we will use both the indicators signal and take BUY or SELL only when both shows same kind of signal.

OVERBOUGHT = when RSI and SS both are overbought
OVERSOLD = when RSI and SS both are oversold.

Note

At any point of time, markets may be in any of 3 state.

– Uptrend
– Downtrend
– Side ways Movement

Understand that these signals work best in range bound market, like we had for last 6 months. When market were moving in range of 3100-2600. If markets are in strong Uptrend or Downtrend, these indicators will generate many false signals.

Hence, In different markets we have to use different strategies.

Uptrend Market : IN Uptrend, you should avoid selling the stock, when there is small correction, Indicators can fast move in oversold region, that is the time you should BUY. But not SELL when prices are in over bought market.

Downtrend Market : In Downtrend, you should avoid Buying the stock, only SELL when the indicators are in overbought region .

Sideways Market : In this market, you can buy and sell both.

Lets see some examples for last 6 months. This was a Sideways market (but still downward bias was there, so be careful with BUY, you can take SELL easily).

DLF Chart

ICICI Chart
RELIANCE CAPITAL


Some Important things to NOTE (very important)

Oscillators should not be used in Isolation alone, You should also confirm it with other things like Support and resistance to make your BUY or SELL more stronger.

For example : If prices are near the Overbought, but you see that prices have broken the resistance point, its tells you that you should not BUY. because Oscillators are secondary thing, prices are primary.

Also, If prices are near support and not breaking it, and oscillator are in over sold area, then its safe to BUY. Never rely just on Oscillators, they are only helping tools used with other signals.

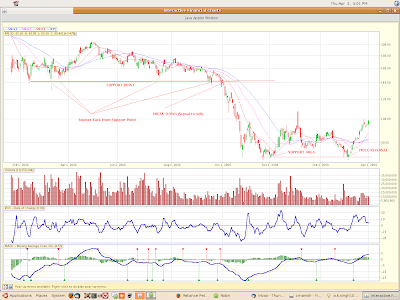
Lets see one Chart of JaiAss for testing what you have learnt.

Questions for you

– Tell me where are the buying and selling opportunities.
– Tell me where you should have avoided the signals.
– What according to you can help along with these oscillators.
– Can you come up with some other oscillator of your own which can measure some important thing )

JAIPRAKASH ASSOCIATES CHART

ok, So finally we end the 4th part of this series of articles on Technical Analysis. I hope you have learnt some things from me.

Earlier Posts

Part 1: What is Fundamental and Technical Analysis and which should be used When

Part 2 : How to use Support and Resistance to BUY and SELL ?

Part 3 : How to use Trendlines to find Support and Resistance ?

Understand that we are not learning how to trade, we are learning some trading tools which can be used by long term traders to make better Buy and Sell decisions .

Incase you want to trade stocks/futures/options just after learning from these 4 articles, I must tell you have you have not learned even 1% required for trading. 99% is still there to be learned and over all knowledge of markets, technical analysis blah blah is just 10%. 90% is Psychology, your attitude and your Discipline.

Trading is risky and not easy to do for long term.

Leave you comments / thoughts / suggestions / and answers to test question.

hey .. wait a min, did you vote on the poll upper right side, I have asked on what all topics do you want me to write. Please select topics from them, so that you also get to read your favorite thing some time 🙂 cheers …

How to use Trendlines to find Support and Resistance

Hi Readers

This is 3rd part of “How to become Better than average investor” Series. Read

Fundamental and Technical Analysis, What and When ?: Part 1
Using Support and Resistance: Part 2.

Let us today discuss how can we use Trendlines to use Support and resistance levels and make better Entry or Exits.

What is a TrendLine?

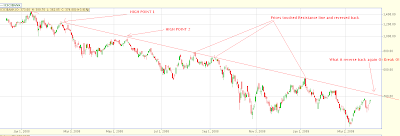
A trend line is a straight line that connects two or more price points and then extends into the future to act as a line of support or resistance. In the Uptrend , we join two low prices points and in Downtrend, we join two high prices and extend it further. Next time when prices approach them, it should probably act as a Support or resistance point.

Let us see one example of each of them.

Example of trend line while DOWNTREND


You can see in the chart how Two high prices were joined and the line acted as Strong Resistance in future, 3 times prices touched it and broke down again, These are good price area where either one can go Short (sell), or book their profits. You can see that now prices are again Approaching to this Resistance line, so once prices reach this point, it may provide a good opportunity to sell.

What will happen exactly, better not to predict and let the market decide?

Understand that we are not saying that prices have to necessarily touch the Resistance line and then go back down , the trend line only provides Resistance, it may again go back much before touching it .

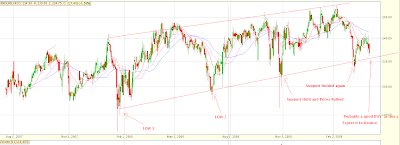
Example of trend line UPTREND

Below if the 2 yrs chart of HIND LEVER, Let us try to make a trend line which acts as support.

If you see the chart, I have connected two low prices and extended it in future, you can clearly see how it acted as support area and prices went back up from there, At the end, you can see how prices are again approaching this support area, most probably this will again hold and it should be a good BUY 🙂

Let us see one more example of Trend lines. This example will show us the following things :

Resistance line using a trend line.
– Breakout
– How Resistance once is broken became Support
Resistance line using trendline for a shorter time frame.

Let us see a 2 yrs chart of JAIPRAKASH ASSOCIATES


You can see here how I joined two HIGH Points and extended the trendline in the future, and how prices reacted to this Resistance line. Recently Prices broke out of this resistance line and then this same resistance line acted as the Support line and prices bounced back from there.

Also, you can see a small trendline, which was made joining the low points . you can see how prices bounced up as this support line held the prices. So, we have seen some examples of Trend lines and how they can act as Resistance or Support lines (as per situation).

Some of the important points to note are :

– It’s more of an art to making a trendline, it depends on how you make them using HIGH PRICE, CLOSE PRICE, etc.

– You can make Trendline for any time frame.

– It’s not necessary for prices to touch trendlines, you should not expect it.

– It’s a wise decision to BUY OR SELL using trendlines. If the trade goes in your favor, let your profits run, if it fails, cut your losses short and accept it. there is no problem with being wrong . even the best in Industry fail.

Trendlines will be of no help unless you control your GREED in markets. Don’t put all your money in a single trade. Keep adequate cash for bad times.

– Once trendlines are broken, take it seriously, it has happened for a reason :).

– Make sure that the two points used to make the trendline are not very near, there should be some time gap between them to believe in them.

– More times the trendline is touched by the price stronger it becomes, And stronger is the break out from that trendline.


Test for you 🙂

Below is a chart, and I have drawn several trendlines in different time frames, I have marked some points with 1,2,3,4,5, please tell me what are each of them and comments on each point. please do it individually. Let me see who comments correctly on each of them. Also, tell me if there is any other trendline that could have been made, but I have left it?


People who are good with Videos can watch the following videos


Please comment on this article, did you like it? Was it easy to understand? Is it too difficult to use Trendlines ?

Conclusion :

So we end this Article here, We saw the Importance of Support and Resistance and how to make trendlines and use them. In the next part (last part), we will see how we can use some of the Indicators from technical Analysis to make the decision better.

Also, we can see that even by visual inspection we can get some idea about which area is support and resistance area.

For people interested in learning these things in detail, I would recommend the book “How to make money trading with Charts” by Ashwini Gujral.


How to use Support and Resistance to Buy or Sell Stocks

This is Part 2 of the How to become a better than average Investor series, see Part 1

In the last post we discussed the importance of Fundamental and Technical Analysis. Now we will see one of the most simple, easy and powerful thing called Support and Resistance.

This is for people who have no idea about what is it and have at most heard about it.

Support and resistance

Let us see both of them one by one.

Support :

Support for a price is a price area where there are lots of buyers ready to buy the stocks rather than sellers. At that price point, the general perception is that its a good buy, and lots of buyers come to buy it. Hence buyers outnumber sellers and there is a higher possibility that prices will bounce back from that point . This is a point where Buying has less risk.

In other words, at support levels demand is thought to be strong enough to prevent the price from declining further. Please understand that Support point is not a place from where it will for sure bounce back, Its only the higher probability that it will bounce back.

Also understand that its not exactly a fixed price which should be considered as Support, generally its a range like 98-100 or 560-570 ..

Which point is Support point : Every Low made by the price can be considered as Support Area.

Let see Example :

Support Example 1 : Below chart is for Jaiprakash Associates (click to enlarge), It made a low of Rs.53 (closing price) on 27th Oct 2008 and then bounced up from there.

Now Rs.53 is the support point, Prices went up from that point and after reaching Rs.90, it again started heading down, You can clearly see in charts that it reached Rs.53 levels, but could not break down from that point and again bounced back from there.

It was a very good “BUY” around Rs.53. Understand that buying around Rs.53, is only a less-risky trade, not a “no-risk” trade. Prices can break down from there also.

Support Example 2 :

Below is a chart of RPL. Here you can see that prices made lows of Rs 70 around Dec 1, 08. That became a support point, and then prices reached thought levels around first week of Mar 09, It bounces back from that point, It was a less risk trade around Rs.70.

Resistance : Resistance is just opposite of Support, At this price levels there are more sellers than buyers and with high probability prices reverses from this point. At this point there are enough sellers in the market to prevent it from rising further.

Resistance point is the High made by a price. All the high’s will act as some kind of resistance points.

Lets see examples :

Resistance Example 1 :

Below is Reliance Charts, You can see that reliance made a high of Rs.1400 around Dec 2008, After that you can see how it reversed from that point 2 times in Jan and Feb 2009. It was a wise decision to sell at those points.

You can also find many examples like this if you investigate yourself. Try to see other charts if you are interested, you can look at charts at ichart.in or https://www.bazaartrend.com/index.php , find yourself)

Important Note : When prices are near Support or Resistance levels, you should be more alert. It does not mean that you just jump onto market and buy or sell, Be patient to see the actual price reversal, Though you will loose some part , that would be a better trade.

Also there are several other factors which should be considered, but for now lets not touch upon them. lets keep it simple for readers.

Lets also look at some important points

Break Down :

Always remember that when prices don’t hold support and break them and fall further, it tells that buyers are not strong enough and Sellers have taken over them and prices will make new lows, When support is broken, Sell further.

Example : Below is the chart of RPL, which shows how it broke down its support point and then made further lows.

Break Out :

When prices don’t hold resistance points and break them on upside, prices then indicate that they are going to make new highs. Better to buy at that point.

I have put a post on my analysis blog for Reliance Break out : please see it :
https://manishanalysis.blogspot.com/2009/04/reliance-break-out-target-1800.html

Some Other points to remember :

1. Support and Resistance points are places where you should be more alert and look for other signals to buy or Sell, just don’t buy because prices have reached near support, buy it when it starts rising and there are positive signals.

2. Support once broken becomes Resistance for next time, and Resistance once broken becomes Support point for next time, use this knowledge. See : https://candlestickmania.blogspot.com/2008/07/resistance-becomes-support.html

3. Many times there are false breakout and breakdown, So it will many times happen that you get out at important levels and miss the large movement, that’s fine, you can always enter after getting out.

4. This is most important point, Everything I talked about in this article can increase your chances of making more money in trading, but remember that you are dealing in Markets, and if you don’t control your GREED and emotions, your failure is guaranteed.

Use strict Stop losses and use Money management techniques (it means not putting all your money at once, if you have 10 lacs, put only 1 lac, don’t be greedy enough, else someday you markets will punish you badly, then no Technical analysis or any thing will help. have good amount of cash with you always ).

All technical Analysis and knowledge are of no help if a person cant control his greed and emotions in Market. TA and your knowledge will contribute not more than 20% of your success in long run.

This was end of Part 2 of this series, In next port (Part 3) we will see how to find support and resistance levels using TRENDLINES. wait for it.

Comments please, Its sometimes disheartening to see no comments after I put up a post after some hard work. I don’t want “good post or Great Article kind of comments, but at least share what you have learned and ask questions, make it little interactive please.

Question for you all :

Question 1 : Do you think this support or resistance thing works , or can you add anything else how to buy or sell and what things to observe at support and resistance levels , which can make buying and selling more successful?

Question 2 : What do you think about Chambal Fertilizrs at this point , see the charts at : https://www.bazaartrend.com/index.php?symbolname=CHAMBLFERT (click on the upper left button to make it full screen).

Suggest what should be done at this point of time ?

I came across very nice video, about difference between winning and success, a worth watch. See it below

Note : All the things discussed here are available on net with great detail. learn more of it yourself.

How to use losses to reduce income tax?

Are losses good? Do they have any benefit?

When you make a loss, do you feel it has nothing to provide or not at all beneficial. The answer is NO! Losses are bad, but our tax laws gives us a way to utilize them in such a way that we can reduce our income tax liabilities.

reduce tax

Let’s see how 🙂 , don’t worry, we will start from scratch and will explain in detail so that everyone can understand .

Let us talk about capital gains in detail today and let us understand how should we utilize it to minimize our tax liability. Things we will discuss would be stocks, mutual funds, Gold , Debt funds, Real Estate etc.

Understanding Terms and Rules

Capital Gains and Loss : Any profit or loss arises from the sale of capital assets is capital gain or loss. Capital Assets Include Shares, Mutual funds, Real Estate, GOLD etc.

Short Term Capital Loss and Profit : STCL for Equity (shares and mutual funds) is when you sell them at loss before 1 yr, for Real estate, GOLD its 3 yrs.

Long Term Capital Loss and Profit : LTCG for Equity is when you sell it after 1 year, for Real estate, GOLD its 3 years.

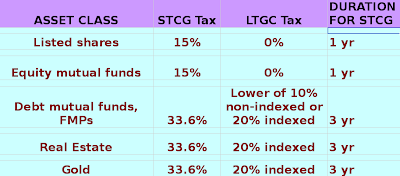
Following is the chart showing the tax treatment and time frame for short term for each asset class. Click on the chart to enlarge it.


General and Carry forward Rules :

  • Short-term capital loss can be set off against any capital gain (Long-term or Short-term)
  • Long-term capital loss can be set off only against long-term capital gain.
  • A long-term capital loss will have no value in a case where the long-term capital gain is exempt from tax. For example, In case of shares or mutual funds after 1 year, LTCG is exempt from tax, so If you hold a share for more than 1 year and then take a loss, That LTCL will have no benefit. This loss cannot be set off against any other income.
  • A capital loss can be carried forward for next 8 years.

How can you utilize the losses ?

As we know that capital losses can be offset with capital gains, we can utilize this advantage to reduce the tax liability.

The main idea is to create losses to offset any profits. There may be the cases where there is an investment on which you are losing, but still you have not booked the loss, but you can book it and use this loss to offset a profit on which you may have to pay the tax.

Let us see some examples

Example 1 :

Ajay had invested Rs.5 lac in GOLD in 2005 and currently in 2009 he sold it for Rs 10 Lacs, Now he made a profit of 5 lacs and it will be considered as a LTCG, as its after 3 yrs. and it will be taxed at 20% indexed (If you don’t know what is indexed, just forget it, don’t worry ). The tax would be around Rs 1 lacs.

Now Ajay also had invested Rs.10 Lacs in Unitech Shares in Apr 2008. His investment has come down to Rs.4 lacs now. But he thinks that it will go up and he wants to keep it and not sell.

Good !! I appreciate his belief that it will go up again. But what is stopping him from selling it today and then again buying it next day.

Watch this video to know 7 ways to save your tax:

What will happen if he does that ?

If he sells his shares and takes a loss of Rs.6 lacs, He now has made a STCL of Rs.6 lacs and law says that he is allowed to offset it with any STCG or STCL. So now he can offset his 5 lacs profit with this 6 lacs loss and hence, he can save his tax of that 1 lac which he had to pay, also he can carry forward a loss of remaining 1 lac which was not offset.

He can again buy his favorite Unitech share the next day. The only loss he will make is the brokerage charges and any fluctuations which may occur in prices, which will not be much, may be it has gone down and he can buy them later at better prices.

So the point is to generate the loss by selling a losing investment and again buying it back in some days. This will help you cook up the loses which then you can offset with existing profits and hence reduce your tax liabilities.

Example 2

Robert had invested 5 lacs in mutual funds in early 2008 or end of 2007 and currently has a good loss of 2.5 lacs (1 yr is still not complete). This is currently every one state, most of the people have burnt their fingers and made huge losses.

Now he is sad that he made losses, He also had bought some shares before some months and made a profit of 50k. Let us also assume that next year his mutual fund will rise to 4 lacs from current 2.5 lacs, which he sells next year.

Now he has 2 choices to make, let us see 2 cases.

Case 1 : He does not book the loss and holds it .

In this case, he will have to pay profit of 15% STCG on his profit of 50k, and next year he will have his current investment at 4 lacs. When he sells it, it will be a loss of lac which will be LTGL (because he had held it for more than 1 yr).

Case 2 : He books the loss of 2.5 lacs and then again buys it back the same day or next day .

In this case, he has made a STCL of 2.5 lacs (bought at 5 and sold at 2.5), Now he can offset his 50k profit with this loss. Then he would not have to pay the tax and he can then carry his loss of 2 lacs carry forward.

Next year, he sells his mutual funds for 4 lacs and makes a STCG of 1.5 lacs (because he has re-bought this mutual fund and 1 yr is still not complete) .. But he can offset this profit of 1.5 lacs with the carried forward loss of 2 lacs, and still carry another 50k worth of loss forward.

So what’s the advantage of case 2 ?

The advantage is that you can save tax on the existing profit and also generate STCL which you can take forward and save tax on future profits.

There are many people who make losses and don’t bother to show it in their returns, if they don’t show it in returns then they will not be able to use it for offsetting purpose in future. Note, The way I have shown the examples have their own benefit and problems, Its you who have to decide what you want and how to utilize the tax rules to your advantage.

Its smart use of knowledge, not cheating 🙂

I wish you have got some knowledge out of this article, please put your comments/corrections/suggestions so that we can do more discussion.

Also, don’t forget to put your vote on the poll at the top of this page.

How to manage ULIPS ? – Tips to become a smart investor

I am finally back from vacation, I feel bad for not writing anything for these 11 days .. I have written a post on GOLD Breakout here , People interested in investing in GOLD may be interested. Let me talk about IRR and ULIPS today.

When we see talk about ULIPS, people generally see its returns over some years , where as its not the true indicator for its actual returns , What we need to see is called IRR.
What are ULIPS ? , read here

ULIP

What is IRR ?

Actually IRR is not only related to ULIPS, its a general concept. IRR is Internal rate of Return, It means returns after adjusting all the costs and expenses. IRR alone is not a single thing we should look at, Its calculated by assuming fixed rate of return like 6 or 10%. The other things to look are its actual performance too.

What are good ULIPS in markets currently ?

Some weeks back there are was a survey and study by outlook money on best Ulips, Birla Sun Life’s ClassicLife Premier and Kotak Life’s, Long Life Wealth Plus were some top funds compared on the basis of IRR. this article talks about the best ULIPS in detail, click on this to read more.

Full article related to ULIPS can be read here

Understand , Choosing a good ULIP is just 5-10% , the main part is how your manage it . how to take care of the advantages provided by ULIP, If you just want to buy a ULIP and sleep for 10 yrs , ULIPS is not for you then . you must buy Mutual funds Instead .

Manging a ULIP is the main part , If you manage a bad ULIP very well , you can earn good returns, but you can loose money by buying Best Ulip in markets and mismanaging it .

How to manage a ULIP ?

Managing a ULIP over a long term is very simple but not easy . You have to do some simple things . Always use switch facility when you anticipate the opportunity .

When you see markets are very high and there is lot of euphoria in market , Decrease your Equity allocation and shift it to Debt . And when you see dull ness in market and everybody is too afraid in markets its the time to shift your money in Equity .

Watch this video to learn how to manage ULIPS:

How to make sure that this is done easily ?

You should find out your Equity : Debt allocation ratio which suits you , which is comfortable for your risk appetite . Once you choose it . Make sure you maintain it once it goes out of sync . So suppose you decide that your Equity:Debt ratio will always be 75:25 . and suppose after an year , you see that it has changed to 65:35 . You should shift some of your Debt part to Equity and bring it back to 75:25 .

You can read how Equity Debt rebalancing helps in long term

This way you will make sure that if Equity has gone up (because if good market performance) , you are shifting some money back to Debt (because now chances to correction is high) and vice versa .

The main advantage of ULIPS is the you can shift between Equity and Debt without any tax liabilities , If you buy Mutual funds and do it , you will pay tax every time you buy and sell it in short time frame (1 yrs) . So until you utilize Switch facility well enough in ULIPS , you are not taking best advantage from your ULIPS .

So as a general rule :

– Increase your Debt allocation once markets are too high and every body is rushing to buy shares in stock markets .
– Increase your Equity allocation after markets are down a lot and there is lot of fear among investors (this is a good time to buy cheap stocks).
– Increase your Debt if you are too confused about what will happen .

Final Note :

If you cant invest for more than 10 yrs and cant look after switch facility and cant monitor markets at broad level , You should stay away from ULIPS, the best thing for you would be to invest in PPF each year and invest in Equity Diversified Mutual funds through SIP every month and review it at least once a year .

Please dont buy ULIPS for just tax savings , dont get out of it in 3-5 yrs . there is 3 yrs locking , but even if you get out in 4th or 5th year , there are heavy penalties you have to pay to get out , which your agent never tells you , Only after 5th year there are free exits .

ULIPS are not bad products , they are only bad if you dont manage it well and buy them for wrong reasons .

How to choose Mutual Funds for tax saving purpose

95% of the salaried people are rushing to invest in tax saving (India). 5% of smart people have already done it (like me). The biggest rush I know must be still for LIC policies and PPF because very fewer people in India invest in Mutual funds still.

How to choose mutual funds

In my earlier posts, I have told which two mutual funds are the best candidate for investing now. They are SBI Magnum tax gain and Sundaram BNP Paribas Taxsaver

Both of these mutual funds are long term consistent performers and come from very respected and best AMC’s in India. Both of these have always been one of the best in the category.

But time changes, situation changes :), We can analyze some numbers and see what are the future prospects for these two mutual funds in comparison to each other. We will see on what basis we can conclude that. Please read the following conversation with my friend. It should give you some idea about how to choose mutual funds and why one could be possible is better than others.

Robert: Hey Manish, need some suggestion from you.

Manish: Hi Robert, what’s up … how is life these days?

Manish: How is a job going on?

Robert: Nothing yaar, I am just busy with my tax savings, have to submit the documents ASAP, so need to invest now, I am thinking of investing in an ELSS, Any suggestions?

Manish: Hmm… See, There are two good funds I think you can invest in, SBI Magnum tax gain and Sundaram BNP Paribas Taxsaver. These are the 5 star rated funds from valueresearchonline.com. You can consider those. But if you only want to invest in one ELSS, I would say go with Sundaram.

Robert: Hmm. Can you give me how you did this analysis and why are you saying that Sundaram looks better than SBI at this moment? I thought if a mutual fund has been long term consistent performer and our time horizon is more than 3-5 years, We can invest in any good funds.

Manish: That is true, I am not saying that SBI is bad and Sundaram is the best, we are trying to see why Sundaram is a better choice for now. We will see the numbers and some charts, and we can look that Sundaram is doing much better than SBI for quite some time.

That gives us a good estimation of which one is good for investing now. So, this requires some long-duration talk, I will have to tell you the details, are you ready?

Robert: ok

Manish: So, Let me first tell you that Since Inception returns for SBI has been 16.67% and for Sundaram its 19.35%, Which is highly respectful .. Let us also look at the following chart of NAV of both mutual funds for last 3 years.

Green: Sundaram
Red: SBI
Blue: Sensex

Manish: You can see that in the last 3 years, Sundaram has outperformed SBI Magnum and also was less volatile than SBI, when it comes to being consistent with Sensex. Also, we must see the last year charts of these two in isolation.

Manish: You can see that Sundaram has taken over SBI around Jun 2008 and has performed better than SBI. You must keep in mind that NAV and index values have been rebased to 100, for comparison purposes only.

Robert: Hmm.. that is fine, I understood that we have some charts which try to prove the point, But there must be other numbers also which favors Sundaram over SBI.

Manish: Yes, let me tell you some things which you can use for comparison purposes.

1. Sharpe Ratio:

Generally, people judge mutual funds performance by the returns only, whereas the better parameter is Return with respect to the risk taken. The Sharpe Ratio of a fund measures whether the returns that a fund delivered were commensurate with the kind of volatility it exhibited.

This ratio looks at both, returns and risk, and delivers a single measure that is proportional to the risk-adjusted returns.

So, the Sharpe ratio is noting but risk-adjusted returns, So the higher Sharpe Ratio is better. Currently, in the Mutual fund’s industry, Sundaram Tax saver and Canera Rebecco mutual funds have the highest Sharpe ratio of 15. SBI has 0.0.

2. Alpha Ratio:

This is a very important ratio in mutual funds. Alpha is a measure of an investment’s performance on a risk-adjusted basis. It takes the volatility (price risk) of a security or fund portfolio and compares its risk-adjusted performance to a benchmark index.

The excess return of the investment relative to the return of the benchmark index is its alpha.

Simply stated, alpha is often considered to represent the value that a portfolio manager adds or subtracts from a fund portfolio’s return. A positive alpha of 1 means the fund has outperformed its benchmark index by 1%.

Correspondingly, a similar negative alpha would indicate an under-performance of 1%. For investors, the more positive an alpha is, the better it is.

Alpha for Sundaram: 3.35
Alpha for SBI Magnum: -1.18 !! (Bad)

3. R-Squared:

R-Squared is a statistical measure that represents the percentage of a fund portfolio’s or security’s movements that can be explained by movements in a benchmark index.

Higher the R-squared Value, closer the mutual fund to the index, what it means is that it will behave like Index funds up to that percentage, which means what if a mutual fund has r-square value of 100, its nothing but an index fund, then why to buy the mutual fund and pay high managing fees, A mutual fund should have a balance in R-square it should not be more than 90 and less than 80.

A mutual fund with less than 80 R-square shows that they have more tendency to be volatile and be close to the index benchmark. forbes.com says: Mutual fund investors should avoid actively managed funds with high R-squared ratios, which are generally criticized by analysts as being “closet” index funds.

In these cases, why pay the higher fees for so-called “professional management” when you can get the same or better results from an index fund.

R-squared for,
SBI Magnum: 94
Sundaram: 87

Read more about the ratios at :

https://www.investopedia.com/articles/mutualfund/112002.asp

Robert: Great !! those ratios are really important parameters while judging the mutual funds. Btw, I understood these things. Any thing regarding holdings?

Manish: Definitely, Ratios are important, but we should also look at simple things like its holdings in different types of companies. See below –

Sundaram Portfolio

[su_table responsive=”yes”]

           Market Capitalization              % of Portfolio
            Giant               56.17
            Large               17.10
            Mid               24.88
            Small               1.85
            Tiny                    —

[/su_table]

SBI Magnum

[su_table responsive=”yes”]

           Market Capitalization              % of Portfolio
            Giant               46.07
            Large               21.48
            Mid               25.52
            Small               6.91
            Tiny               0.01

[/su_table]

If you compare the investments by Sundaram, it has a high concentration in Giant companies and has avoided investments in Small and Tiny Companies, which helps in avoiding Risk (also returns can be affected, but more important is managing risk).

Also in the future when Markets improve and start rising, front line stocks (big companies) will be the first to move up.

Robert: Any other small things to consider?

Manish: Other things you should see are

Expense Ratio (lower the better) : Sundaram : 2,.24 , SBI : 2.5
Market Turnover
PE Ratio: Lesser is better
PB Ratio: Lesser is better, SBI is better in this Market Capitalization There are many other,

Robert: That is fine, but I can see that SBI is ranked 1st when you consider 5 yrs return and Sundaram is 2nd, I saw it on Value research online site.

Manish: True, But did you see its 3 yr Rank also? Its 5th !! and did you see 1 yr rank: its 12th for SBI Where as Sundaram is 2nd in 5 yrs, 1st in 3 yrs and 2nd in 1 yrs return category, which gives an indication that Sundaram is taking over as one of the best funds available over SBI slowly.

Robert: Hmm.. that makes sense, Great !! I would really consider these points, this helped a lot. Manish: My Pleasure !! But please understand that there is no guarantee that Sundaram will outperform SBI next year or from now on. There is just a high possibility for it, because of our analysis.

Question: Guys (and gals) … Do you know who is Robert and Manish 🙂 Ans: Both are Me … :), I just created this talk to present the article and learning in a different way and to make it practical and enjoyable .. I hope you all liked it.

Note: Please note that the views and analysis are personal, there may be some error, if someone finds any please, let me know. I will correct it. But I am sure there is no mistake or error in data.

Source: valueresearchonline.com and forbes.com

Six Investment Rules which will help you to manage your emotions better and become a better investor.

This is a nice article by Charles Delvalle based on Investment Rules, i am just reproducing his work on this blog.

Have you ever been on a losing streak and felt like there was no way for you to make money in the markets? I think we all feel that way from time to time. It’s natural. After all, our emotions are never static.

Equity investment rule

The worst part is that when we’re in that mindset, we can actually create a self-fulfilling cycle. Maybe we’re trying too hard. Maybe we get sucked into a variety of different indicators that we never followed before. Or perhaps we get into one trade hoping that it’ll make up for all the losers we just had.

Nine times out of ten, it never works out though. The end result is that you lose more and more money. But it doesn’t have to be that way. So here are six simple rules for you to follow that will help you manage your emotions better and become a better investor.

Rule #1: Hope to make more money, fear to lose more.

In the book Reminiscences of a Stock Operator, this was one of the most important lessons that trader Jesse Livermore learned in his time as a trader.

When he got into a position and it started losing money, he realized that he had to get out of it quickly (cut your losses). So what he’d do was to fear that he’d lose more money and get out of the trade. On the other hand, if the trade was going his way, he would hope to make even more (let your winners ride).

Rule #2: Stick to Your System, NO MATTER WHAT.

This is a tricky rule to stick to, even for experienced traders. But the truth is this: If you have a system that you know for a fact works, then don’t stray from it. You will only end up losing money.

Why do investors stray? Sometimes it’s the feeling of invincibility they get after they’ve won a few trades in a row. Other times it’s simply because they are desperate to hit a winning investment. Whatever the reason, when you stray from your system, you stray from what you know works. Ignoring what you know is never a good way to make money.

Rule #3: Don’t become attached to your money.

Sounds easy, right? You’d be shocked how hard it is to actually implement. Too many people put money in the stock market that shouldn’t be there. If this is your retirement, or tax money, or money you owe to somebody, DON’T USE IT IN THE STOCK MARKET! Only use money that you can afford to lose.

Rule #4: Don’t play catch up.

If you’ve hit some losses in the stock market, the last thing you should do is ‘double up’ and hope to hit a winning trade. What if you don’t win? You will lose twice as much and be in even more pain.

Listen, losses are a part of the game. Every investor in the world loses money from time to time, but if you’re system works (rule #2) then stick to it and you should end up back in the green in no time.

Rule #5: Don’t over-analyze things.

I can’t tell you how many times I open up the Wall Street Journal and see an article that goes completely opposite to what I believe to be true about a particular sector or investment. Does that mean I listen to them? In all honesty, I look at the argument and see if it has merit. If it doesn’t, that’s it. I stick to what I believe to be true unless something drastically changes.

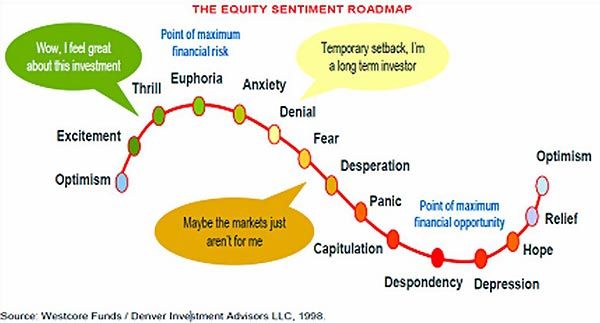
Equity sentiment roadmap


In my trading arsenal, I have a few indicators I look at and then have certain beliefs about the market and sector based on a few people I trust and what I know of the market. Everything else is just static. It’s only there to agitate you.

Rule # 6: Listen to yourself.

One thing I’ve learned is that as you trade, you find out new things about yourself. You find out what your true fears are (fear of success, maybe?), you find out your weaknesses (maybe not following your system to a T), and you find your strengths (maybe you make money best in certain sectors).

As an investor, you need to pay attention to all of these things. That way if a certain emotion is cropping up and threatening to lead you in the wrong direction, you could quickly stop it and move on.

Watch this video to know more about Investment Rules:

If you can stick to these six rules, you’ll be able to have a much better grasp of your emotions while you trade.

What do you like about this article? Do you want to ask any query? leave your reply in the comment section.

Are you willing to buy term plan? – Here are some important tips you should know before buying term insurance

We will today discuss some of the best practices and must do things while taking a Term plan.

Click here to read what is Term Insurance and its Importance

Tips before buying term Insurance

1. Take a policy just before your Birthday.

Term Insurance premium depends on your Age. So if possible try to avoid taking the policy just after your Birth date. What i mean by this is that try taking it before you turn +1 year in age. If your Date of birth is 10/11/1983, and you take the policy on or before 10/11/2008, you will be considered of age 24.

But if you do a delay of 2 days … and you take a policy on 12/11/2008. You will be considered 25 yrs old and hence your premium will increase by 4-5%.

Note : It does not mean that if your birthday just passed by and now you want to take Insurance, then you should wait for another year. that’s not what i am saying 🙂

For example:

For a male with DOB on 10/11/1983 (24 yrs old), the premium for Rs 50,00,000 cover with tenure of 25 yrs, is 10157, if the policy is taken on 09/11/2008 (just 1 day before the birthday). Where as if he takes the policy on 12/11/2008, the premium will shoot up to 10647 (Rs 490 more) .. though 490 is a small amount, but if we can avoid it by taking the policy little early .. always try to do it.

Even a small amount like 490 saved over 25 yrs in a PPF would give 45,000 and in mutual fund with 12% return will give 77,000.

Note : The gist of the point is that try to see this small point while taking the Term insurance, it does not mean that you wait for 8-9 months just to take the policy before a birthday.

2. Try to diversify your Policy

If possible try to diversify your policy amount over different Insurance companies. If you want to take an Insurance of 50,00,000, it would be better if you take 2 polices, rather than 1 single policy.

How it helps?

– If you hold a single policy and the company does not honour the claim, dependents wont get anything, but if there are 2 parts, then there are less chances that both the companies with not honour the policy.

– If your liabilities come down or you have less dependents after a couple of years and ultimately you need to bring down your Life insurance cover, you can simply stop one of the policies and continue the other one.

– It helps in diversifying the risks involved with the Insurance company.

3. Buy a policy early in life and for longer Tenure.

Its always recommended to buy a Term Insurance early in life and for maximum tenure possible. In your early life you are more healthy and hence your premium will be lowest. Also by taking insurance for a large tenure you are making sure that you are covered for a large period, but the premium will be marginally more.

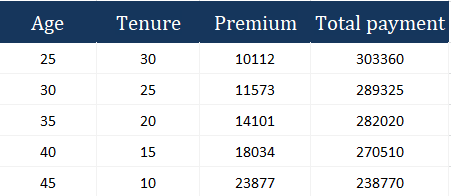
For example : For a cover of 50,00,000

Example - why it is necessary to buy term insurance early


You can see here that you have to pay marginally more for an extra cover of 5 yrs. So for example, a person with age 25 will pay 14,000 more than the 30 yrs old, but he will be insured for 5 additional years. So it always pays in long term.

Also taking a 30 years term insurance once will be very cost efficient than taking a 20 yrs term insurance now and then taking a term insurance of 10 additional years after 20 yrs. Because after 20 yrs, the premium you will pay for that 10 yrs tenure term insurance will depend on your Age that time and health that time.

Note : Premiums are from Aegon Religare Life Insurance.