Some Investment advice from P V Subramanyam

“You dont save for Retirement these days , You invest for Retirement these days” . Great Words , P V Subramanyam is an excellent Financial Planner . I read his posts and enjoy it at lot . Here is a video from him , which explains some of the basic and important advice from him .

Please share your views on his advice and let me know if you like these kind of Videos or not … Shall I put more of  these of not ?

List of Best Debt Oriented Mutual Funds for 2009-2010

If you don’t like Equity because you have a lesser risk appetite and  still you want to make better returns , where do you invest ?

The answer is Debt Oriented Mutual funds , In this article we will see What are Debt Oriented Mutual funds , A list of Good mutual funds and what are the returns you should expect from them .

mutual funds

Have a look at List of Best Equity Diversified Mutual Funds. These funds are getting very popular these days as people are not ready to put their money in market for long term because of Market Uncertainty and decreased risk appetite after the recent fall in 2008-2009 .

Hence these Debt Oriented Mutual Funds have become very popular , Read This Article

What are Debt Oriented Mutual Funds ?

Debt Oriented Mutual Funds are those Mutual funds which Invest primarily in Debt products like Debentures , Certificates of deposits from Corporates , Govt Bonds etc , They put a small portion in Equity also (10-40% max) . These funds generally return in range of 10-20% in long term and the downside is limited in these Mutual funds as Debt Component is High.

Please note that even these Funds can give Negative Returns but that happens in Extreme fall downs or very bad times. You should not assume these will always give positive returns. Also You should also concentrate on Long term returns, Dont judge a Mutual fund by Its Short term Returns

Let us see some Stats which will give you more idea about these .

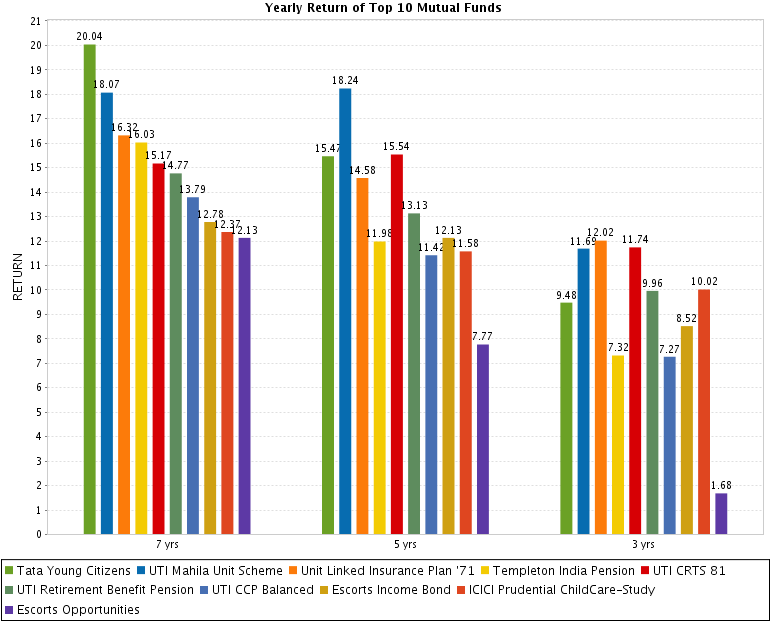
  • In 7 yr time frame Best return is 20%and worst return is 8.09% .
  • In 3 yr time frame Best return is 12.09% and Worst return is -5.87%  .
  • 5 funds are more than 10 yrs old .
  • Most of the Funds do not have an Entry load, but can have exit loads if exited before 2-3 yrs . Some have locking period also , but no tax benefit .

Below is the Chart I created which Shows CAGR return of Top 10 Debt Oriented Mutual Funds (Click to Enlarge)

List of Best Debt Oriented Mutual Funds

Source : ValueResearchOnline.com

List of Best Debt Oriented Mutual Funds

UTI Mahila Unit Scheme

  • 16%+ return Since Launch, 8 yrs old Fund , Excellent Track Record .
  • This is my Favorite Mutual Fund . Amazing one .. Read a complete review for this Mutual Fund Here

Tata Young Citizens

  • 14 yrs old Fund, Excellent Returns , This is extremely Risky Fund .. Don’t consider this as a Debt Oriented Fund
  • Equity Component is very high at 50% . So I am not sure if this will suit as Debt Oriented Fund .. only people with strong heart should take this .

UTI CRTS 81

  • One of the Best Funds , 28 yrs old fund , Lambi Race ka Ghoda , 13%+ return CAGR which is amazing for any debt oriented fund .
  • Equity Exposure of less than 30% and the worst return ever in 1 time period is -14% , the best is 35-40% in a year .

HDFC Multiple Yield Plan 2005

  • 4 yrs old fund , Extremely low Equity Exposure of less than 15% ,  Average return
  • Looks great for Future performance .

Other Good Funds

  1. Birla Sun Life Asset Allocation Conservative
  2. Templeton India Pension
  3. Unit Linked Insurance Plan ’71

Note : please make sure you read all the other details yourself before you decide on buying , These are just my personal opinion and make sure you are your own decision maker 😉 .

Last year when markets were doing bad , Debt Funds were the best choice of the Investors , However Its not the best time to Invest in pure Debt Funds , but rather invest in Debt Oriented Funds if you are not ready to take high risk.

Look at the following Video which Is not a recent one, but talks about How investors were eager to invest in Debt Funds Last year .

Conclusion

If you don’t have very high Risk Appetite , you can look for alternatives to Debt Oriented Mutual Funds , Its always better to park your funds with these if you want more than 10% return with some amount of Risk .

Please note that These are not equity Diversified funds and hence you should not expect very high returns from these .. If you get around 10-12% from these funds that is more than good . Anything more is wonderful .

Please share your comments. Do you think you will invest in these funds, Are the returns from these Mutual funds are worth looking at them? Any do you know of any other fund which is not covered here? Please leave your comments.

Rebirth of Jagoinvestor , We will get more Awesome now

jagoinvestor moved to wordpress Readers , We have successfully moved to WordPress platform and its a very emotional moment for me. This blog has been my baby and I have nurtured it all these 2 yrs. Today it has grown up and now comes another important milestone , Jagoinvestor is now one of the few handful of blogs on Financial Planning , which is known to deliver high quality content on the topic .  I am sure moving to WordPress will boost more traffic to this blog and over all ranking would improve in search Engines because of better SEO capabilities .

This blog needed some Investments from long time and finally I have done some investments on this blog like

  1. Hosting on bluehost.com
  2. To give you an awesome User Experience , I Bought Premium Thesis Theme (this is considered one of the most amazing themes in WordPress , very Optimized for SEO and very easy to manage , we will see in coming days)
  3. I Hired a Professional for Migrating it to WordPress , I wanted to make sure nothing breaks in migration and Its done quite fast so that the blog is available to readers and not down for a lot of time .
  4. This is not monitory Investment , but more important investment and thats time investment by me , I would now be reading more stuff (for my personal growth and To write on more diverse topics for you all) . Also I am now planning to be more regular from now onwards because I am now taking this blog more seriously . Expect More articles but with smaller sizes 🙂 and more frequently , but remember that  “Key to Happiness is Low Expectations” . I am also starting my personal blog in some days which will contain my random posts and life experiences (Will update you later) .

I am in no mood of writing anything till this weekend now , So lets use this time to get suggestions from you all on what all new things we should do on this blog . I have Some suggestions and ideas , may be you can vote for it or give your own 🙂 .

Suggestions

1. Add Forums: Readers can make their profiles and then start discussions on some topic . You can talk over variety of topics like Mutual funds , Insurance, Taxation , Stock markets , products review , any thing else related to Finance and Investing .

2. Start a Knowledge base of products , topics and services in Financial Domain . It would be like Wikipedia of Indian Financial planning world , we can have any topic , idea or whatever … and have details , we can have opti0n of any user editing it so that it can grow quickly and you can also contribute .

3. More Videos More videos and audio tutorials

4. More Calculators and Presentations to make things easy for you ..

5. We can have podcasts and Live tutorials where we can meet (limited people , Free sessions , through registrations only) and we can talk over some topic .

6. Personal Consulting through Skype or Phone (you will call me) , Only for people seleted by me through Quizs and Contests coming soon …

Feel free to suggest Ideas which can help this blog grow .

Some Updates and Clarifications

1. I am receiving a lot of mails now on random topics directly , Please make sure that you ask important and worthy questions , I still get “I have bought XYZ at Rs 30 , please advice” kind of mails , I would not be answering those questions , please use Logic ”

2. This blog is still not getting readership which It should get and deserves , So from your side what you can do is

  • A lot you who are working in company’s must be having an internal mailing list where you talk to other people on random topics , feel free to put excerpt of articles and give back a link to this blog .
  • If you have a blog or site , feel free to review it on your blog so that your readers can know about it . I would take this as your giving back to this blog . Noting more than this . mail me if you do this . Atleast you can put a link back to this blog on the sidebars .
  • Talk more about this to your friends and feel free to send them a good article which you come across , like some review of product I do .

Thanks

overall I am a One team person doing everything and we have to act as a whole family to grow , Incase you can do this small part from your side , It will make a big difference .

Note : Over 2-3 weeks , please expect some random changes happening to the blog . I would be making a lot of mistakes and then re-fix them to learn a lot .

Jagoinvestor is Moving to WordPress

Readers , I am extremelly excited to announce that We are moving from Blogger to WordPress now . It has been amazing experience till now and now I have decided to move to WordPress . After I migrate to WordPress , I will have better control over everything and we will have much more things on this blog .

When is the Migration ?

So the day of Migration is 11th Nov 2009 , Wednesday . Hence , This blog might be down for some hours on Wednesday , at worst the whole day .

What Happens after we move to WordPress

We are going to make this blog much more exciting and much more happening place after we move to WordPress . We will add things like

  • Forums (where all the readers can interact with each others) .
  • Profile Pages for all the Readers
  • Videos section
  • Calculators Section
  • Much better feel and look (someone help me with some good theme please, any WP experts here)
  • Overall it would take time and I things will be added slowly .

Well , all this has happened very fast and i am writing this post in a hurry .. so please bear with me 🙂 .

Please give me some time to get back in form and become familiar with WordPress , expect some low activity on blog for 1-2 weeks . See you all at new Jagoinvestor.com@Wordpress 🙂 .

As always , I would like to hear your comments 🙂 .

If you Liked the post , Subscribe Here and get the posts directly in your Inbox

Review of UTI Mahila Unit Scheme Mutual Fund , Excellent Mutual Fund

Have you seen a Diamond or anything equivalent to that ? No ? I will show you one today . I am going to review a fund which has performed so well that It despite being a Debt oriented Mutual funds has given returns which we expect from Equity over long term . Yes !! ..

UTI mahila unit scheme mutual fund

This fund has no more than 30% allocation in Equity ever and despite that, it has given a long term return of 16.6% (at the time of writing) and has many more accolades to its credit . Lets have a deeper look .

UTI Mahila Unit Scheme-G [Link]

Most of us run around to find the best equity fund who will give us excellent returns . In long run , an average person requires 12-15% of annual returns on his investments , and this fund has given close to 16% return Since Inception . This kind of return what we should expect from equity in Long term .

This is a Fund which is open only for Women of India , Males who wish to invest in this Fund can ask their wives to Invest , Make sure you understand the Income tax Clubbing rules .

Highlights of this Fund

  • 8 yrs old Fund (Inception Apr 2001)
  • No Entry Load
  • Exit Load of .75% if sold before 1 yr (as on 21/10/09)
  • Return Since Inception : 16.6%
  • 5 yrs return : 18.28%
  • Best return in 1 yr time frame is +54%
  • Worst return in 1 yr time frame is -10% .
  • Consistently outperformed Its Benchmark ( Crisil H 75:25 ) and ‘Category Average” in all the time frames
  • Can not invest more than 30% in Equity .
  • Well Diversified Portfolio across Equity and Debt investment .

Comparison with Nifty

Below is the chart of Nifty and UTI Mahila Unit Scheme till Dec 08. You can see how its has given close returns like Nifty. Primarily this fund is a Debt Fund, 70% of this Fund is always in Debt + Cash, only maximum 30% funds are in Equity at any point of time, And still this fund is giving such an excellent Returns.


Who should Invest in This Fund ?

Mainly this fund is a very less risky fund with very high return , You can invest in this fund in Following Scenarios

  • If you have short term goals for 2-3 yrs, You can invest in this fund, You have to accept that event this fund has equity exposure and in really bad times, even this can disappoint you. Don’t expect it to return the above returns with surety, Its just expectation and you know how “expectations” are broken in Life 🙂 . Key to Happiness is Low expectations 🙂 .
  • People near their retirement life and who can take moderate amount of risk can park some part of their money in this fund (Dividend Option) .
  • People who are very conservative and adore Fixed Income Products like FD’s , Endowment Insurance , NSC etc and willing to taste “high returns” can put some money here.

Other Alternatives or Good Funds in Same Category

  1. UTI CRTS 81
  2. Unit Linked Insurance Plan ’71
  3. FT India Life Stage FoF 40s
  4. Birla Sun Life Asset Allocation Conservative

Disclaimer

I have suggested this fund to some of my Paid Clients as part of their Investment Planning , but final decision of Actually investing in this fund is their itself if they want to invest in this or not !! . I do not guarantee the returns (who does ? )

Comments

Please share your valuable comment and tell us about some other fund as an option . Also let us know if you found this Mutual funds good or not !! .

Note : Wrote this article while travelling from Varanasi to Delhi

Mis selling by an LIC agent

Many people have been sold LIC policies without making them understand what is that policy and how is that structured for you.

I have recently been informed by one reader how an LIC agent sold her a policy claiming it to be “a great opportunity” and gave her wrong information about the policy and the actual thing was totally different, which she discovered from another LIC agent years after.

Now the situation is a total mess. [Written in Train, Posted from Home]

mis-seling

Mis-selling from an LIC agent

Hello manish..

I have been taken for a ride by a cheating “char so bees” LIC agent. Please help me. In 2006 I got married and moved in with my husband to a very remote mountainous region. Soon we had a Lic agent pestering my husband about taking a ” good” life insurance.

I had read in a Readers Digest issue about term insurance and asked the agent about the same. But that shameless fellow said that such a thing was not available in LIC.

Since he was the most “renowned” agent, I trusted him and took the next best thing he offered – a 22 year 16 lakh money back policy Jeevan Anurag in which I would have to pay Rs1.21 lakh per annum for 7 years after which we would start getting money back( Rs80,000 in the 7th, 8th, 9th, 11th, 12th, 13th, 15th, 16th, 17th, 19th, 20th, 21st year and 3, 4, 5, 9 lakhs in the 10th,14th,18th,22nd year).

He also said that our as our policy got older we would have to pay less premium. I did’nt quite understand when he gave us 4 policy papers and questioned him about it on two occassions. But he asked us to trust him and ” reap the benifts of this incredible policy”.

I had my doubts but I was naive and did not want any trouble. 2 months back we got transferred to a more” civilised” town and soon we had a new LIC agent knocking our door. As we talked about my previous policy this new agent said that he has never heard of such a policy and asked to see the papers.

I was dumbfounded when the agent told me that I dont have a 16 year policy but 4 different policies of 4 lakhs each for 10,14,18 and 22 years of which the premiums are Rs 46032, Rs31842,Rs 24355, Rs19357.

Jeevan Anurag provides the following assured benefit-“..an amount= 20% of of basic SA at the start of the year during the last 3 years before maturity shall be payable . At maturity balance 40% of basic SA+bonus…”.

That cunning man had arranged the policies in such a way that when one reached maturity the other just stared paying up. I feel so stupid for having been duped. I have already paid 4 premiums(4.9 lakhs)…

now I am in such a state of confusion that I dont know what to do next. Should I discontinue or should I continue ???

I see a lot of sense in what you say and I would really like to invest into some of your ideas but my money is stuck and I dont know where to go from here..Where I live the only financial advisor available is the LIC agent and I dont trust a word he says so please show me a way out.. I really need your help.

And is there a way I can get back at that sleazy agent? Help?? please..

Read the review of Jeevan Tarang Policy from LIC

Answer

oops .. that really hurts ..

I can see that you are mis-sold the policy , The returns which you mentioned to me also looks little cooked up , please check the numbers once again , if needed involve that new LIC agent to find out what is the exact money you are going to get back in different years .

If you have 4 lacs policy for 10, 14, 18 and 22 years, then that 80k figure is correct. but looks like the 3,4,5,9 lacs thing little cooked up . you should be actually getting 1.6 lacs + Sum assured in each 10th, 14th, 18th and 22nd year.

Looks like this has overestimated the sum assured part and made it 3,4,5 and 9 lacs, This might happen but the probability for that is close to 0. Ask the new LIC agent to estimate how much is it…

My estimate is not more than 2.5 lacs in each 10th, 14th, 18th and 22nd year. max 3 lacs… Apart from this the premium of 1.21 lacs is to be paid upto 7 yrs, that is true, but after that, only the first premium will stop, the other 3 will continue and then 2nd will stop in 10th yrs .. and so on.

As you can see from https://www.licindia.com/children_need_001_benefits.htm that the premium stops only at n-3th year of a policy . Please try to understand the policy yourself.

Truly speaking, I am more mad on you guys than that LIC agent

Regarding tracking down that LIC agent , you might have phone or address or some sort of contact . If not , Contact LIC and find out your LIC agent name and agent number or something . File a complaint with LIC on this matter and once its not taken care within 2 months, file a compaints with IRDA on this .

Take this matter to consumer court . I am giving all these suggestions but not sure if this will be of too much help , because you guys have signed the document which says “I hereby understand and agree with Policy Document and am responsible for all the invesment decision” , Hence I am raising my hand to help you but fingers are crossed .

Apologies if I my words sound little rude , but I am an emotional person .

Comments

What do you think about this issue, Do you know how to track that agent again, Anyone can help this person? Contact me…

Questions and Answers , Part 5

Here are a set of 5 questions and answers asked to me on “Ask a question section”. These questions are on the topics on ULIPs, General Investing and Achieving Financial Goals, Stocks. You can also look at other Questions and sections part here at Part 1, Part 2, Part 3 and Part 4

ask a question

Question 1# [Stocks] – by Ramesh Rao

sir, I bought rei agro ltd at Rs.48/- for short term of 1 week or 10 days.
I am observing it for the last week its not moving much higher than the price i bought. so what should I do, please guide me, shall I wait for a week.

Answer

I do not give recommendation about stocks as I mentioned in the form itself. Anyways its too late now for me to reply, but I will give you basic advice, I can see that you dont have a strategy in place for trading, thats very dangerous in long term.

Please understand one thing very clearly, Random trading will never make you money in long term, its just a blind gambling. So learn Technical analysis basic, Master the psychological issues involved in Trading. Once you make money in Paper trading for 3 months ,then move to real trading, there is study and experience both behind my advice.

Question 2# [ULIP] – by Vivek Kumar

I am looking to invest around 6 lacs in next 3 to 4 yrs period with a view to get a return of more than or equal to 15 lacs in next 10 years. Considering the recovery mode of market what should i go for, I have come across this plan called TATA AIG Invest Assure Apex, should i go for this ulip or something better u all cud recommend…! cons

Answer

Expecting 6 lacs to become 15 lacs in 10 yrs is very realistic and acheivable target, Here is the plan

– Invest 12,500 per month for 4 yrs (total 6,00,000) in Mutual funds through SIP. Take 3 different Mutual funds.
Assuming a return of 12% (1% per month) over 10 yrs, which is like very much possible, you will have 15.8 lacs in 10 yrs.

>>> (12500 * (1.01) * ((1.01) ** 48 – 1)/.01 ) * (1.01)**72
1582275.5728728396

You can mix up your investments like this

– totally in Equity diversified Mutual funds,
– Mix of Equtiy Diversified + Balanced Funds
– Mix of Equity funds + Some Debt funds
– what ever else you can make yourself (be creative)

I don’t like to take plans from companies because thats like giving away all the fun in other hands then, Dont hesitate to excute your investment plan as I suggested, Its too easy to execute and does take much time and you get to learn seomthing out of it.

Question 3# [Making Long-term corpus] – by Aakaash Nair

Your blogs are excellent coming from someone of your age. Kudos to you. I can save about 60K per month and would like to have that multiply to about 2 Crores in the shortest possible realistic time. What would be the best way to achieve this, apart from Gambling of course 🙂

Answer

Thanks for the appreciation, Regarding your Query .. The best way to find the answer of shortest possible time is to find out what is the realistic rate of return you can expect over some tenure. I would say that over a long term you can expect 12% and it can go upto 15-20%, but let’s be conservative and expect 12% only.

So if its 12%, then it’s pretty simple equation where we have to find the tenure which generates 2 crores from 60k per month

>>> (60000 * (1.01) * ((1.01) ** 156 – 1)/.01 )
22555868.687736

With simple maths, we can see that 156 months (13 yrs ) is a good time frame to achieve this. It might be achieved early also, but let’s be conservative in this as the amount invested per month is high and there can be changes of slumps in between which can affect psychologically.

I would recommend this

– Utilize PPF for this as it will take a small part of your investment. (70K per year)
– Put a small portion in DIrect Equity after doing some research on stocks and give them time to grow (monitor them every year)
– Start a SIP in 2 good Sectoral Funds (10% amount)
– Start a SIP in 5-6 different good Equity diversified Mutual funds.
– Rebalance your Portfolio every year as per your asset allocation (let’s have 80:20 or 75:25)

The above mix is quite good in Risk appetite. which I assume is fine.

Question 4# [Stock Trading] – by Shubhankar

Hi, I am very much thankful to whatever information u have provided. I trade in options and its intraday or 3 to 4 days positional. So can you please suggest what time frame I will select to get the right moves -for example today is 28th August.. .

Now what time frame I will choose fr Nifty/Stock PE for September series so that I can capture either side of nifty/stock movement.

Answer

You have asked very innocent question, The answer is, that right moves are in every time frame, its you who have to configure yourself for some condition and time frame and startegy, there are people who make money in every kind of time frame,

Decide what is your time frame as per your life style, level of involvement you want, kind of strategy you have. Read my ebook : https://manish.pucsd.googlepages.com/A_Small_Guide_For_Newcomers_In_Stock.pdf

Question 5# [Financial Planning] – by Manpreet

You have a great site. I must congratulate you first for your efforts!

Frankly, your articles have been eyeopeners for me, and I’m now in a fix, about what to do with my existing insurance/ulip policies.

I have the following policies:

1. Birla Sunlife Dream plan:

Premium = Rs. 50700 p.a.
Sum assured – Rs. 1908000
Coverage period = 20 years
Start date – 27/07/2009 (have paid 1 premium so far)

2. LIC Profit Plus (T.No. 14)

Premium = Rs. 20000 p.a.
Sum assured – Rs. 200000
Coverage period = 20 years (premium paying term is 5 years)
Start date – 18/12/2007 (have paid 2 premiums so far)

3. LIC Endowment Assurance Policy

Premium = Rs. 27540
Sum assured = Rs. 600000
Coverage period = 21 years
Start date = 28/09/2008 (have paid 2 premiums so far)

4. MNYL Life Maker Premium ULIP

Premium = Rs. 20000 every six months
Sum assured = Rs. 400000
Coverage period = 10 years (premium payment term is 5 years)
Start date = 07/09/2008 (have paid 2 premiums so far)

And, my wife has the following policies:

1. LIC’s Money Plus (T.No. 180)

Premium = Rs. 100000 (single premium)
Sum assured = Rs. 500000
Coverage period = 20 years
Start date = 06/02/2007

2. ICICI Prudential LifeStage RP

Premium = Rs. 100000 p.a.
Sum assured = Rs. 500000
Coverage period = 10 years
Start date: 08/02/2008 (have paid 2 premiums so far)

After going through your articles, I’ve realized that I’m wasting my money by investing in these policies. How can I exit out of these policies? When should I do it? And, where should I invest my money instead both from investment & tax-saving POVs?

My age is 27 yrs, and my wife’s age is 25. We both work in the IT sector. And, we would love to buy a house/apartment in 5-10 years frame. What can be the best financial plan for us?

Any kind of advise would be helpful. Thanks for your help.

Answer

OK , lets take it easy .. Manpreet , your Finances are not in great shape .

You people are paying 2.37 lacs per year as premium (excluding single premium) for your Investment Planning , please dont tell me you still think its a Insurance Policies 🙂 .

WIth this kind of Premium every year , you Insurance is still a tiny 41 lacs which seems to be a small coverage for you guys . I can smell around 1 crore Insurance requirement for you people (assuming no assets) .

Your Insurnace Requirement can be met with a small premium of 23-24k per annum for 30 yrs tenure . You will be left with 2 lacs every year in that case to invest somewhere else ..

Using PPF + SIP in Mutual funds and may be some Pension products , you can generate atleast 12% return which is totally possible , you can generate close to 3 crores in next 25 yrs .

Regarding getting out of your Policies now , I can see that you have paid 1 or 2 premiums in most of them .. this is a very critical situation , which can not be handled easily now .. I would recommend still pay for polices you have to and once they recieve surrender value after minimum lock in period, then take them out and make your Investments more easy and simple .. for now .. make sure you take Term Insurance for another 60 lacs .. for a penny amount of 13-14k per annum ..

The current situation is too messy and complicated , I would not day BAD , but messy . Its not simple .. too much clutter there . You need a simple Term Plan for you and your Wife , Two PPF accounts (you and your Wife) , a bunch of mutual funds linked to your Financial goals , A family Floater Plan and may be 1-2 FD’s .. thats it ..

Some ULIPS you have might be goodone and can be used for some investment , but still they wont be the best thing .. This the all advice i have with the given situation . You might want your Financial planning to be done professionally , because there might be small small issues and one time restructuring for long term is required I guess . take your call ..

And one more thing , I almost forgot .. How are you claiming for tax deduction with so much of premium? Tax planning is also not up to the mark .

Apologies if I scared you , but thats my 100% real reaction .. I cant lie 🙂

4 Charts which will change your perception about Equity

“Invest in Equity for Long term” You might have heard this sentence from me and others numerous number of times, but have you ever thought, why I say so? Or what is the logic behind that? What is the authenticity of what I say? Why should you believe me?

Hence, I came up with the most time consuming article of this blog till date. Lets explore the world of Equity today and I will show you some amazing numbers and graphs which will change your perception about Equity.

Equity

To make this article Crisp and short, I will show you 4 charts and explain each of them that will show you Power of Equity. Mainly the idea of this post is to show you the return potential of Equity in Different time frames and to find out what is the kind of return we should expect from equity in Long run like 15-20-25 yrs.

For the sake of calculations and source of reference, for almost all of the article I have used value of Sensex Index, but it should be almost similar for any Index Fund, ETF, or a Equity Diversified Mutual fund.

All the below study is based on historical 30 yrs of Sensex data from the year 1979.

1#Sensex Return Chart

Sensex has returns close to 18% CAGR in the long term till date for One time investment and SIP investment.


This chart shows you the CAGR (Compounded Annual Growth Rate) return of Equity after each passing Month. I have manually noted down the Index value for each month starting from Mar 1979 – Sept 2009 (total 350 months approx) and then did some number crunching (actually a lot) and came up with the CAGR returns the index has given for that time frame.

For example: for the month 36, the Index value was 218.82 and my starting Index value was 122.23 (Sensex actually started from 100, but I had a little late data). So the actual return was 23.16% for SIP investment and 20.78% return for one time investment.

So this chart shows that if you had Invested your money in the start and then hold it for a particular time frame then what will be your CAGR return till that point.

The chart shows the return for two kinds of Investment modes: SIP and One time investment. So Blue line shows the CAGR return if you did SIP investment and the RED one shows the CAGR return if you had invested in Start and sold after ‘n’ number of months.

View Data

Points to Note

  • In the Short term, returns have Wild Swings which is the basic nature of Equity
  • In the long run, returns were in the range to 18-23%, where it goes up and down because of Bull and Bear markets. See Nifty PE Analysis
  • SIP performed better than One time for starting 4-5 yrs and then SIP and One time investment were close enough.

2# Nifty Return Chart

Nifty has given returns close to 18% for SIP investment and close to 12% in 12 yrs from 1997-2009 .


This one is similar to the above chart just that it is for Nifty 12 yrs data. This chart shows you the CAGR return of Nifty after each passing Month. I noted down the Index value for each month starting from 1979 – 2009 (total 146 months approx) and came up with the CAGR return the index has returned up to that point.

For example: for month 120, the actual return was 23.33% for SIP investment and 13.17% return for One Time investment. So this chart shows that if you invested your money in the start and then hold it for that particular time frame then what will be your CAGR return till that point?

View Data

Points to Note

  • You can clearly see that the returns kept increasing with Tenure and there were less wild swings up and down with Returns.
  • SIP performed better than One time Investment in all the time frames. See that blue line was always higher than Red one for any given month.

Do you like the articles on this blog, Fill Fan book

3# Absolute Average Return for Each month (Sensex Data)

This shows you how much of absolute average return in percentage terms would you get if you hold your investment for X months.

This is an interesting Chart. It shows how much of absolute return can you expect when you hold your Equity investments for 1 month, 5 months, 50 months or 200 months. I will tell you how each duration is calculated.

Let’s say duration is 12 months, so what I did was that I took all the 12 months time periods like Apr 1979-Apr-1980, Mar 1979-Mar-1980, June-1979-June-1980 and like this the last 12 months time duration Sept-2008-Sept-2009, total of 113 different values, then calculated the Returns for each time frame and calculated the average of those 113 time frames.

I finally got average returns of 12 months Investment horizon (total 113 values for 1-13, 2-14, 3-15 month Index value). So I got a single value of 25.60% for 12 month time frame. This is absolute Return and not CAGR return.

So, if I invest 100, I get 125.60 as return.

Please make sure that you understand that this 25.60% is the simple average of 113 values, there might be many values which may be negative, 0, or may be 100%. But we are more interested in what is the average of all such values.

In the same way the Absolute Average return for 120 months was 672.60%, which means that 100 invested would have become 772.60 in 5 yrs. Please understand that we are just trying to show this as the time frame increase the return potential of equity goes up and up.

Don’t interpret it as the return guarantee for any time frame. It’s Equity, Respect it else it will punish you badly for your Ignorance.

View Data

Points to Note

  • In the long run, the average return has increased
  • For close to 15 yrs, the returns on Equity kept increasing but at a lower speed.
  • from 15 yrs to 29 yrs, the Absolute return increased very fast
  • So the real power of equity comes with long term.
jagoinvestor on Facebook

4# Number of Times the return from investment was Positive for some time Frame (Sensex Data)

This graph shows that how many times an investment has returned positive for some particular time frame, for example for 4 yrs time frame (48 months). There would be many 48 months time frame like Mar-1979-Mar-1983 OR Jan-1994-Jan-1998 or any other date, out of all those 48 month time period, the investment gave positive returns for 87.36% times.

So this graph shows how the number of times went up and up as the time duration was more and more.

For a particular time frame like 50 months, I calculated returns for all possible 50 month window and then saw how many number to times it gave positive return and then divided it with total number of times to get the percentage of times, the return was positive.

So if there were total of 200, “50-month” period and 180 times the return was positive. The result would be 90%. I did this same thing for every time duration from 1-300 months and plotted the graph.

View Data

Points to Note

  • One an average the chart was rising, which kind of proves that Risk of losing in Equity decreases as time duration increases.
  • After 11 yrs, there was no instance when equity return was negative, which means that you invest any time in Sensex index and take your money out after 11 yrs, you will not lose. The return would be positive always.
  • For smallest time frame of 1 month, the percentage was around 55%, which shows that for smaller time frame the equity returns are random like coin toss which is 50%-50% possibility. But as time horizon increases its more of power of Equity, rather than randomness.

Get Free updates on your Mobile

Conclusion

Many people are afraid of Equity because it can give negative returns, which is 100% true and possible, but people do not understand that its not a short term wealth building asset class. Its some thing for long term.

When you invest in Equity for Long term, you are bound to get excellent returns given that you have faith on Statistics, Historical performance and the concept of Equity in general. You can also maximize your investment performance by active participation in your investment and honoring Asset-allocation and portfolio re balancing from time to time.

Time spend and tools used to this article

You might have spent 20-30 min to read this article, but I spend close to 25-30 hours on

  • Finding data
  • Doing calculations
  • Making Computer program in Python: See the Python Code written by me for this article
  • Making Charts in Excel, See Chandoo.org for excellent Tips
  • Actually Writing this article

Comments Please, I would like to hear your views on this article and your views on Power of Equity. Is there something to be added? And Did this article succeed in changing your views about Equity or not?

Note : I will be on vacation now and will keep posting some articles whenever I get time .=”

Don’t Judge a mutual fund by its Short Term Performance

“Don’t judge a person by their Sunday appearance” applies to Mutual funds also. Best Mutual funds are the best over most the time frame and Worst mutual funds are the worst performers in most of the time frame.

What I mean by this is that the best performers return wise in 5 yrs, 3 yr and 1 yr are almost at the top and worst performers are always in the bottom for 5 yr, 3 yr and 1 yr time frame. Let us look at the Chart of mutual funds performance

I compiled a list of 78 top mutual funds on the basis of 5 yrs Return and plotted a graph of returns for 5 yrs, 3 yrs and 1 yrs for them accordingly. To smooth out the data, I took a 10 period moving average (i.e. I took an average of Top 10, then an average of 1-11, then 2-12…) Just want to see what is the pattern of Mutual funds list. Have a look below:

Source: Valuereserchonline.com

If you look at the chart above, you will see that the Best performers (Top 10) were in the best performers list for 3 yrs and 1 yr time frame also. And at the same time, the worst performers in 5 yrs time frame were the worst performers in 3 yrs and 1 yr time frame, whereas the opposite was not true… See this video post on how to choose a good mutual fund for yourself?

Here are the Learning’s and conclusions:

Do not judge a mutual fund by it’s short-term Performance like 1 yr

There were many mutual funds who gave top returns in 1 yr time frame (See the orange line, see all the top positions) but not all of them were the best in 5 yrs time frame. The same thing happened with 3 yrs time frame: there were 2-3 mutual funds at the top in 3 yrs time frame but they were not best in 5 yrs time frame. See why SIP works well in long-term

Short-term performance does not give enough indication of Long-term

This is common sense, just like meeting a person for few hrs or days cannot tell us about his/her nature or behaviour, the same way a mutual fund cannot give a good indication of its long-term perspective from short-term performance.

In the above chart you can see that if I gave you just one year performance chart and it was sorted by returns, you could never tell which amongst the top would also be at top in 5 yrs time frame.


Bad performance in short-term should not be taken too seriously.

This is kind of same thing which I said above, but let’s see it with a different perspective. Short-term performance should not be the only reason for selling your mutual fund or Shares. We generally take our decisions based on short term performance, that is true for Life also.

We need patience and give time to our investments to show its true colors. Good investments happen by giving time to your investments and Early Investing, not just by choosing one.

Comments please, your 4-5 kind words will help me know if you liked it 🙂

Current Situation of Stock market , What should you do now ?

Markets are at their 15 months high. Retail investors are back and I am sure you must have got the left out feeling by now, as stock market have gained more than 100% in last 6 months.

What shall one do now, Shall we invest for long term now, Will markets go up or down. Trading is Probability and hence we shall take our decisions based on probability only. Lets see what are my views on current market conditions.

People who have just started in Stock market should have a look at my “How a beginner should start in Stock Market” Ebook.

Current Situation of Stock Markets

Markets have crossed important levels of 4850 before some days and have been stable there for some days .. Once it crosses 5300, which is another important level, I would be very much bullish then and will be willing to agree that markets can again see the all time high of 6000+ in another 1 yr.

See the chart below.

Source : icharts.in

Above is a 3 yrs weekly chart of Nifty. If you see the chart below you will see that another important resistance is at 5300 and you can also see some good negative divergence on ADX . This gives an indication that we must be cautious at the moment .. The upside might be limited to 5300, from where it can take a reverse turn.

But, As you must be knowing, markets are supreme and hence if it sustains that level. We will have to obey its order and remain bullish. You should have a look at Deepak Shenoy article on Nifty P/E and EPS growth some days back.

What about Nifty PE?

As of 21st sept 2009, current Nifty PE is at 22.40. Now this kind of number is not show very attractive valuation for long term. Below is the chart of nifty PE for last 3 yrs .. you can see how its has crossed important zone of 20+ and now heading to 25 which I personally consider as “SELL at any cost” level at the moment.

Nifty PE

Even though High nifty PE of 22 does not reflect great valuations, it can be used as short term indicator for catching some momentum move . So I would love to buy right now to get out at 10%-15% profit in another 1 month or so, or till market reverses heavily . But I would not like to make some long term commitments right now at this level, Better wait than never.

So what are the Possibilities

  • Markets can reverse now anytime before touching 5300 levels
  • Markets can sustain 5300 levels and then see 6000+ levels from where it will crash again

Conclusion

This post is just trying to see where we are and not trying to entice you to do trading, trading is a personal activity and can be done in many different ways. Where is will market go is a trivial question, the more important thing is “what will you do when market moves in any direction”

If you have any doubt you can leave your query in our comment section.